|

NZD/USD Price Analysis: Forming a rectangle as it unfolds in a range

  • NZD/USD trades in a range which could represent part of a Bull Flag continuation pattern.
  • Conditional on a break above the range highs the pair could rally up to the targets for the Bull Flag. 
  • Alternatively a break lower is possible, bringing the uptrend into doubt. 

NZD/USD has spent the last week or so forming a range bound consolidation (shaded rectangle on chart) which could represent the flag square of a Bull Flag continuation pattern. 

The pair is probably in an uptrend on a short-term basis, favoring more upside in line with the saying “the trend is your friend”, however, a break above the rectangle’s highs at 0.6153 would give more confirmation of an extension higher. 

NZD/USD 4-hour Chart 

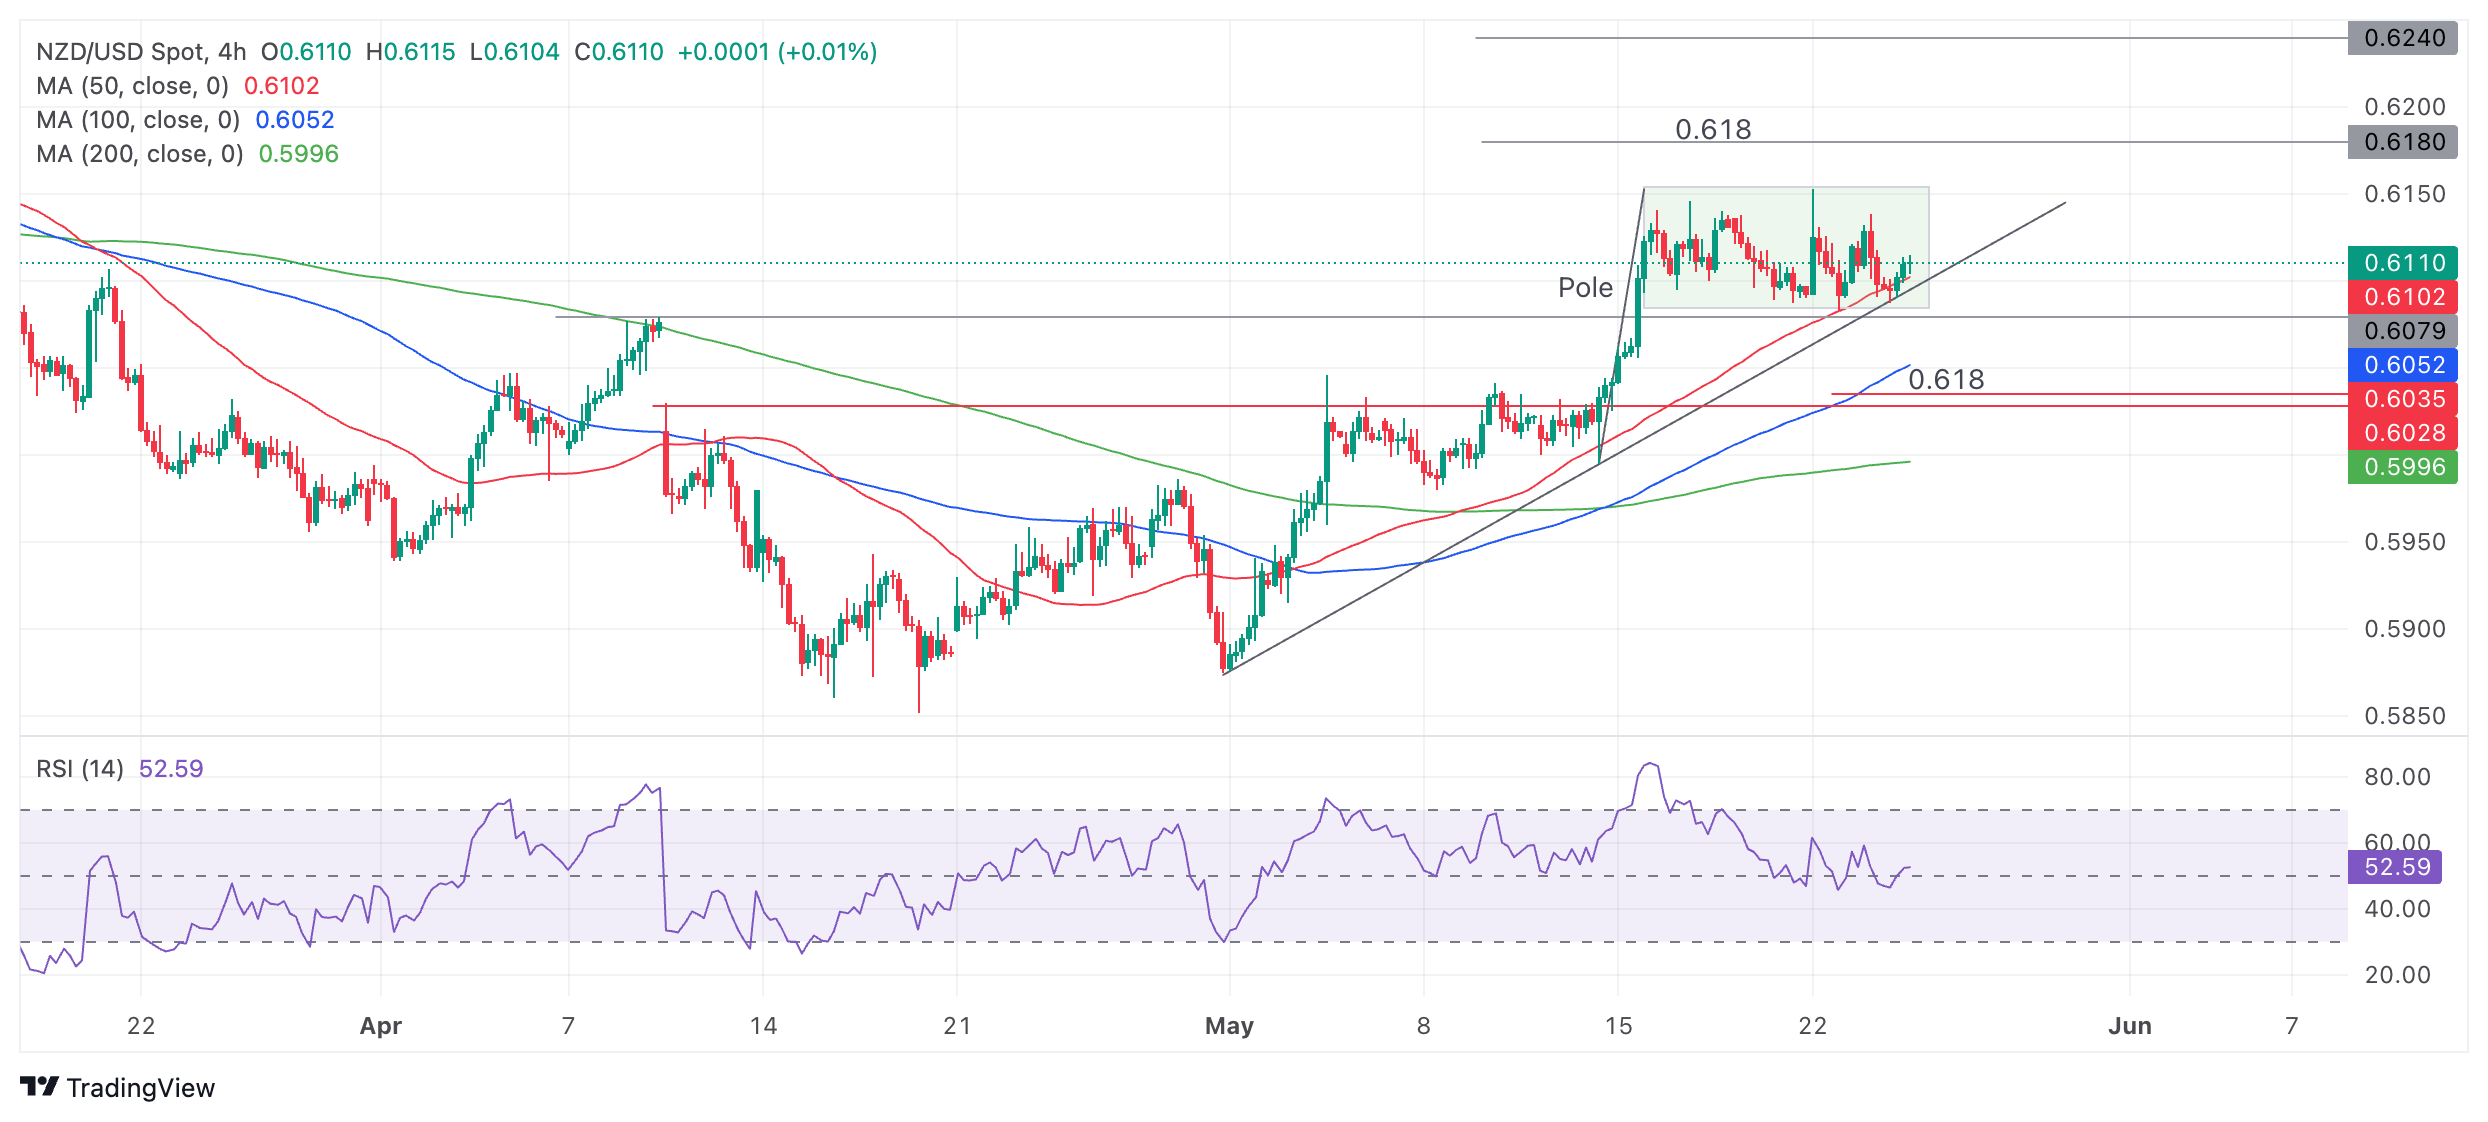
Such a breakout would probably see the price rally up to 0.6180, the first target for the Bull Flag pattern. This is calculated by taking the length of the “pole” and extrapolating it by a 0.618 Fibonacci ratio from the base of the rectangle higher. This is the conservative target for the pattern but a more bullish move could even reach the 0.6240 target at the 100% extension of the pole higher. 

A breakdown is also possible, however, and a break on a closing basis below the rectangle’s base would negate the Bull Flag hypothesis and suggest a more bearish tone to the chart. Such a break would also pierce the trendline for the move up during May and likely see NZD/USD decline to a downside target at 0.6035, the 0.618 Fib. ratio of the height of the rectangle extrapolated lower.  

Author

Joaquin Monfort

Joaquin Monfort is a financial writer and analyst with over 10 years experience writing about financial markets and alt data. He holds a degree in Anthropology from London University and a Diploma in Technical analysis.

More from Joaquin Monfort
Share:

Editor's Picks

EUR/USD flirts with daily highs, retargets 1.1900

EUR/USD regains upside traction, returning to the 1.1880 zone and refocusing its attention to the key 1.1900 barrier. The pair’s slight gains comes against the backdrop of a humble decline in the US Dollar as investors continue to assess the latest US CPI readings and the potential Fed’s rate path.

GBP/USD remains well bid around 1.3650

GBP/USD maintains its upside momentum in place, hovering around daily highs near 1.3650 and setting aside part of the recent three-day drop. Cable’s improved sentiment comes on the back of the Greenback’s  irresolute price action, while recent hawkish comments from the BoE’s Pill also collaborate with the uptick.

Gold clings to gains just above $5,000/oz

Gold is reclaiming part of the ground lost on Wednesday’s marked decline, as bargain-hunters keep piling up and lifting prices past the key $5,000 per troy ounce. The precious metal’s move higher is also underpinned by the slight pullback in the US Dollar and declining US Treasury yields across the curve.

Crypto Today: Bitcoin, Ethereum, XRP in choppy price action, weighed down by falling institutional interest 

Bitcoin's upside remains largely constrained amid weak technicals and declining institutional interest. Ethereum trades sideways above $1,900 support with the upside capped below $2,000 amid ETF outflows.

Week ahead – Data blitz, Fed Minutes and RBNZ decision in the spotlight

US GDP and PCE inflation are main highlights, plus the Fed minutes. UK and Japan have busy calendars too with focus on CPI. Flash PMIs for February will also be doing the rounds. RBNZ meets, is unlikely to follow RBA’s hawkish path.

Ripple Price Forecast: XRP potential bottom could be in sight

Ripple edges up above the intraday low of $1.35 at the time of writing on Friday amid mixed price actions across the crypto market. The remittance token failed to hold support at $1.40 the previous day, reflecting risk-off sentiment amid a decline in retail and institutional sentiment.