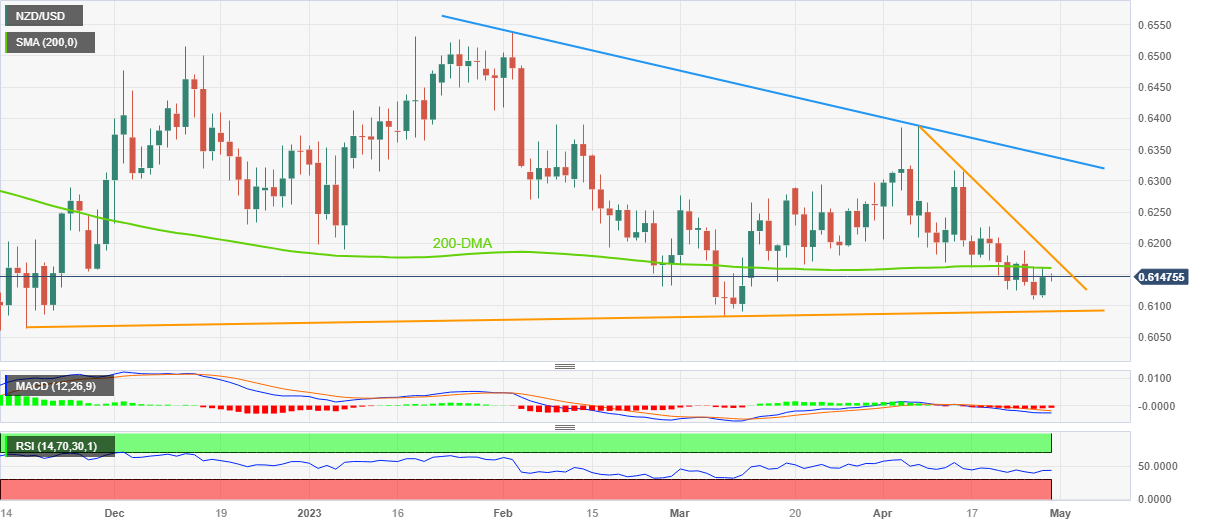
- NZD/USD picks up bids to reverse late Thursday’s pullback from 200-DMA.
- Bearish MACD signals, steady RSI keeps Kiwi pair sellers hopeful.
- Three-week-old descending trend line adds to the upside filters.
- Upward-sloping support line from November 2022 becomes crucial to watch NZD/USD bears.
NZD/USD regains upside momentum after two failed attempts to cross the 200-DMA hurdles, grinds higher around mid-0.6100s during early Friday.
Not only the repeated failures to cross the 200-DMA hurdle, around 0.6160 by the press time, but the bearish MACD signals also weigh on the Kiwi pair prices. That said, a steady RSI (14) line signals further grinding of the NZD/USD.
It’s worth noting that the quote’s break of the 200-DMA resistance surrounding 0.6160 isn’t an open welcome for the bulls as a downward-sloping resistance line from early April, close to 0.6180 could challenge the pair’s further upside.
Even if the NZD/USD price rallies beyond 0.6180, multiple levels marked during late March around the 0.6200 threshold can act as the last defense of the bears.
On the flip side, the recent bottom around the 0.6100 round figure can prod the NZD/USD bears before directing them to the key support line stretched from November 2022, around 0.6090 at the latest.
Should the NZD/USD pair offers a daily closing below 0.6090, the previous monthly low of near 0.6085 and the mid-November 2022 bottom of around 0.6065 may act as an extra filter towards the south before welcoming the bears with open hands.
NZD/USD: Daily chart
Trend: Further downside expected
Information on these pages contains forward-looking statements that involve risks and uncertainties. Markets and instruments profiled on this page are for informational purposes only and should not in any way come across as a recommendation to buy or sell in these assets. You should do your own thorough research before making any investment decisions. FXStreet does not in any way guarantee that this information is free from mistakes, errors, or material misstatements. It also does not guarantee that this information is of a timely nature. Investing in Open Markets involves a great deal of risk, including the loss of all or a portion of your investment, as well as emotional distress. All risks, losses and costs associated with investing, including total loss of principal, are your responsibility. The views and opinions expressed in this article are those of the authors and do not necessarily reflect the official policy or position of FXStreet nor its advertisers. The author will not be held responsible for information that is found at the end of links posted on this page.
If not otherwise explicitly mentioned in the body of the article, at the time of writing, the author has no position in any stock mentioned in this article and no business relationship with any company mentioned. The author has not received compensation for writing this article, other than from FXStreet.
FXStreet and the author do not provide personalized recommendations. The author makes no representations as to the accuracy, completeness, or suitability of this information. FXStreet and the author will not be liable for any errors, omissions or any losses, injuries or damages arising from this information and its display or use. Errors and omissions excepted.
The author and FXStreet are not registered investment advisors and nothing in this article is intended to be investment advice.
Recommended content
Editors’ Picks

AUD/USD flat lines above 0.6500 ahead of RBA Meeting Minutes
The AUD/USD pair trades flat near 0.6505 amid the consolidation of the US Dollar (USD) during the early Asian session on Tuesday. Investors will monitor the Reserve Bank of Australia (RBA) Meeting Minutes, which is due later on Tuesday.

EUR/USD: The extension and duration of the rebound remain to be seen
EUR/USD regained further balance and trespassed the key 1.0600 hurdle to clock three-day highs following extra weakness in the Greenback and some loss of momentum around the Trump rally.

Gold hits $2,600 on falling US yields, geopolitical woes
After suffering large losses in the previous week, Gold gathers recovery momentum and trades in positive territory above $2,600 on Monday. In the absence of high-tier data releases, escalating geopolitical tensions help XAU/USD hold its ground.

Ethereum Price Forecast: ETH risks decline to $2,258 as exchange reserves continue uptrend
Ethereum (ETH) is up 1% on Monday after ETH ETFs hit a record $515.5 million inflows last week. However, rising exchange reserves and realized losses could trigger bearish pressure for the top altcoin.

The week ahead: Powell stumps the US stock rally as Bitcoin surges, as we wait Nvidia earnings, UK CPI
The mood music is shifting for the Trump trade. Stocks fell sharply at the end of last week, led by big tech. The S&P 500 was down by more than 2% last week, its weakest performance in 2 months, while the Nasdaq was lower by 3%. The market has now given back half of the post-Trump election win gains.

Best Forex Brokers with Low Spreads
VERIFIED Low spreads are crucial for reducing trading costs. Explore top Forex brokers offering competitive spreads and high leverage. Compare options for EUR/USD, GBP/USD, USD/JPY, and Gold.
