|

NZD/USD Price Analysis: Extends gains towards psychological resistance at 0.6200

  • NZD/USD seems to test the immediate barrier at the 0.6200 level.
  • Technical analysis indicates a momentum shift in an upward direction.
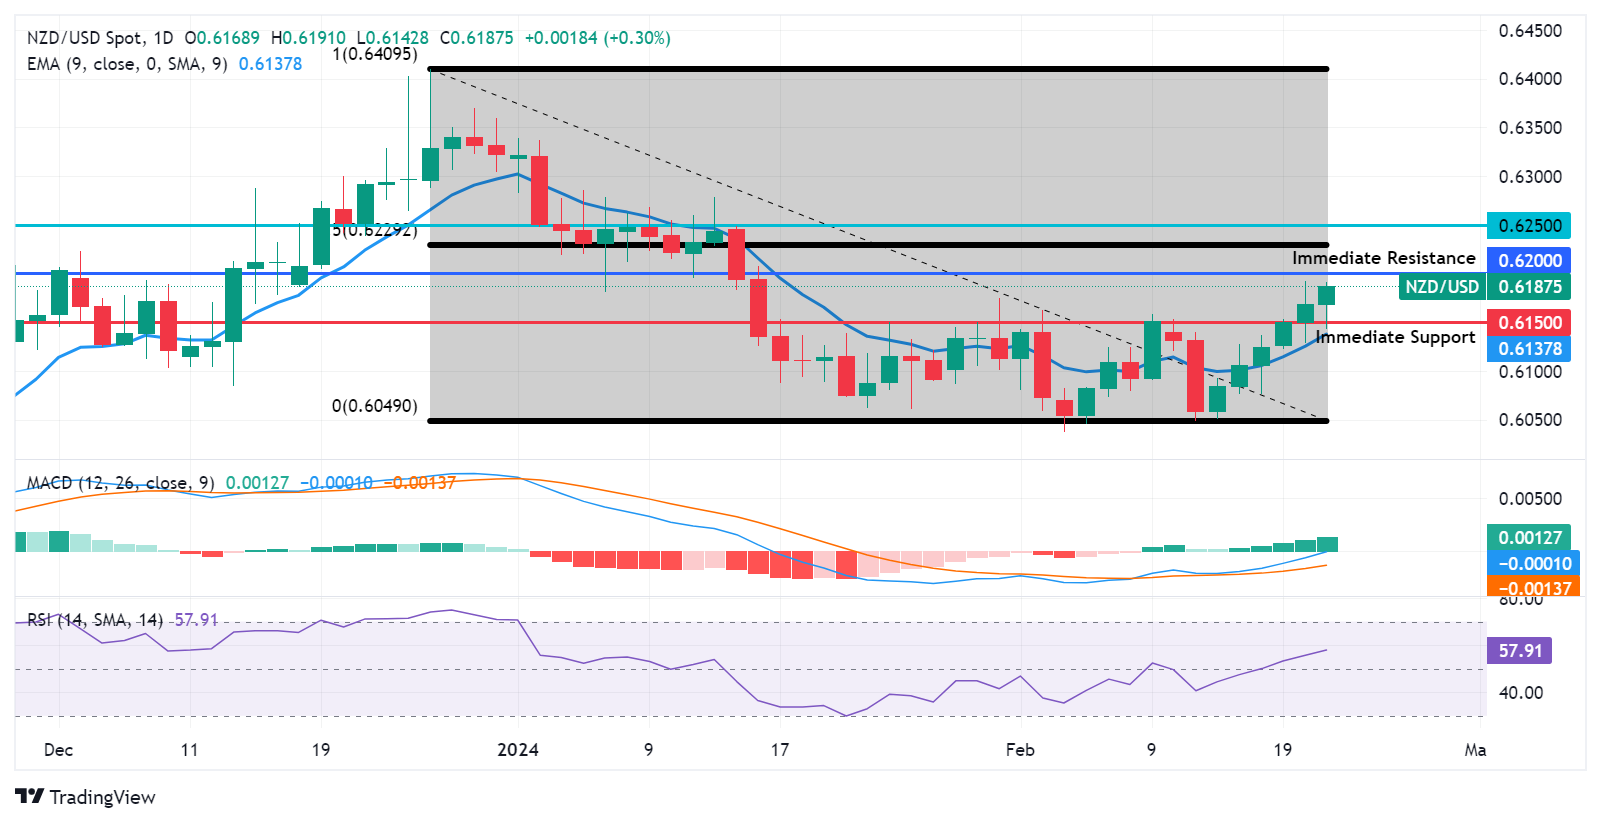
  • The pair could find a support region around the major level of 0.6150 and the nine-day EMA at 0.6137.

NZD/USD continues to extend its winning streak that began on February 14 on the subdued US Dollar, which could be chalked up to the lower US Treasury yields. The NZD/USD pair rises to near 0.6190 during the Asian trading hours on Wednesday.

The NZD/USD pair may encounter immediate resistance near the psychological threshold of 0.6200. A decisive breakthrough above this psychological barrier could provide upward momentum, potentially leading the pair to explore levels around the 50.0% retracement level of 0.6229, followed by psychological resistance at 0.6250.

Technical analysis indicates a shift in momentum towards the upside. The Moving Average Convergence Divergence (MACD) line, positioned below the centerline, displays divergence above the signal line. Traders are likely to await confirmation from the MACD for a clear directional trend. Moreover, the 14-day Relative Strength Index (RSI), a lagging indicator, is above the 50 level, indicating a bullish sentiment for the NZD/USD pair.

On the downside, immediate support for the NZD/USD pair is anticipated at the key level of 0.6150. A breach below this level could exert downward pressure on the pair, potentially testing the nine-day Exponential Moving Average (EMA) at 0.6137 before approaching the psychological support level of 0.6100.

NZD/USD: Daily Chart

NZD/USD: other technical levels

Overview
Today last price0.6188
Today Daily Change0.0019
Today Daily Change %0.31
Today daily open0.6169
 
Trends
Daily SMA200.6111
Daily SMA500.6182
Daily SMA1000.6082
Daily SMA2000.6077
 
Levels
Previous Daily High0.6192
Previous Daily Low0.6129
Previous Weekly High0.6153
Previous Weekly Low0.6049
Previous Monthly High0.6339
Previous Monthly Low0.6061
Daily Fibonacci 38.2%0.6168
Daily Fibonacci 61.8%0.6153
Daily Pivot Point S10.6135
Daily Pivot Point S20.61
Daily Pivot Point S30.6072
Daily Pivot Point R10.6198
Daily Pivot Point R20.6226
Daily Pivot Point R30.6261

Author

Akhtar Faruqui

Akhtar Faruqui is a Forex Analyst based in New Delhi, India. With a keen eye for market trends and a passion for dissecting complex financial dynamics, he is dedicated to delivering accurate and insightful Forex news and analysis.

More from Akhtar Faruqui
Share:

Markets move fast. We move first.

Orange Juice Newsletter brings you expert driven insights - not headlines. Every day on your inbox.

By subscribing you agree to our Terms and conditions.

Editor's Picks

EUR/USD declines toward 1.1700 on solid USD recovery

EUR/USD turns south and declines toward 1.1700 on Wednesday. A solid comeback staged by the US Dollar weighs heavily on the pair, as traders look to USD short covering ahead of US CPI on Thursday. However, the downside could be capped by hawkish ECB expectations. 

GBP/USD slides toward 1.3300 after softer-than-expected UK inflation data

GBP/USD has come under intense selling pressure, eyeing 1.3300 in the European session on Wednesday. The UK annual headline and core CPI rose by 3.2% each, missing estimates of 3.5% and 3.4%, respectively, reaffirming dovish BoE expectations and smashing the Pound Sterling across the board. 

Gold clings to modest gains above $4,300

Following Tuesday's volatile action, Gold regains its traction on Wednesday and trades in positive territory above $4,300. While the buildup in the USD recovery momentum caps XAU/USD's upside, the cautious market stance helps ithe pair hold its ground.

Bitcoin, Ethereum and Ripple extend correction as bearish momentum builds

Bitcoin, Ethereum, and Ripple remain under pressure as the broader market continues its corrective phase into midweek. The weak price action of these top three cryptocurrencies by market capitalization suggests a deeper correction, as momentum indicators are beginning to tilt bearish.

Ukraine-Russia in the spotlight once again

Since the start of the week, gold’s price has moved lower, but has yet to erase the gains made last week. In today’s report we intend to focus on the newest round of peace talks between Russia and Ukraine, whilst noting the release of the US Employment data later on day and end our report with an update in regards to the tensions brewing in Venezuela.

AAVE slips below $186 as bearish signals outweigh the SEC investigation closure

Aave (AAVE) price continues its decline, trading below $186 at the time of writing on Wednesday after a rejection at the key resistance zone. Derivatives positioning and momentum indicators suggest that bearish forces still dominate in the near term.