- NZD/USD has sharply dived below 0.6020 amid mixed China’s Official PMI data.
- China’s Manufacturing PMI at 48.8, lower than the estimates of 49.4 while Non-Manufacturing PMI jumped to 54.5 vs. 50.7.
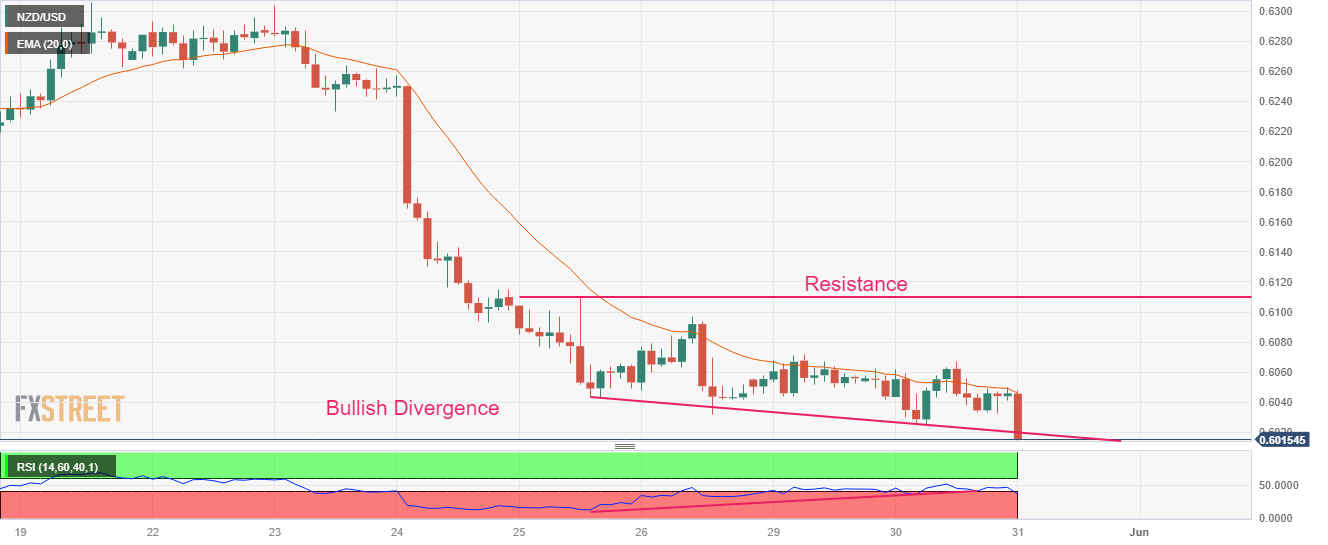
- NZD/USD has formed a Bullish Divergence which indicates exhaustion in the downside momentum.
The NZD/USD pair has tumbled to near 0.6016 after the release of mixed China’s official PMI data (May). China’s National Bureau of Statistics (NBS) has reported Manufacturing PMI at 48.8, lower than the estimates of 49.4 and the former release of 49.2. While Non-Manufacturing PMI jumped to 54.5 from the consensus of 50.7 but remained lower than the former figure of 56.4.
The US Dollar Index (DXY) has extended its retreat move further below 104.04 as an approval of a raise in the US debt-ceiling has weakened its appeal. Going forward, the USD Index will be guided by the release of the US Automatic Data Processing (ADP) Employment Change data.
Going forward, New Zealand Dollar will continue its action ahead of the release of the Caixin Manufacturing PMI data (May). As per the consensus, the economic data is seen steady at 49.5. It is worth noting that New Zealand is one of the leading trading partners of China and a stagnant China's factory performance could impact the New Zealand Dollar.
NZD/USD has formed a Bullish Divergence on a two-hour scale, which indicates exhaustion in the downside momentum. The Kiwi asset was consistently making lower lows while the momentum oscillator Relative Strength Index (RSI) (14) made higher lows. The bullish divergence would get triggered after a decisive break above the crucial resistance of 0.6070.
The 20-period Exponential Moving Average (EMA) at 0.6048 is still acting as a barricade for the New Zealand Dollar bulls.
A confident break above the immediate resistance of 0.6070 will drive the Kiwi asset toward the horizontal resistance plotted from May 25 high at 0.6110 followed by May 01 low at 0.6160.
On the flip side, a downside move below the intraday low at 0.6015 will expose the asset for a fresh six-month low toward 11 November 2022 low at 0.5984. A slippage below the latter would expose the asset toward 02 November 2022 high at 0.5941.
NZD/USD two-hour chart
Information on these pages contains forward-looking statements that involve risks and uncertainties. Markets and instruments profiled on this page are for informational purposes only and should not in any way come across as a recommendation to buy or sell in these assets. You should do your own thorough research before making any investment decisions. FXStreet does not in any way guarantee that this information is free from mistakes, errors, or material misstatements. It also does not guarantee that this information is of a timely nature. Investing in Open Markets involves a great deal of risk, including the loss of all or a portion of your investment, as well as emotional distress. All risks, losses and costs associated with investing, including total loss of principal, are your responsibility. The views and opinions expressed in this article are those of the authors and do not necessarily reflect the official policy or position of FXStreet nor its advertisers. The author will not be held responsible for information that is found at the end of links posted on this page.
If not otherwise explicitly mentioned in the body of the article, at the time of writing, the author has no position in any stock mentioned in this article and no business relationship with any company mentioned. The author has not received compensation for writing this article, other than from FXStreet.
FXStreet and the author do not provide personalized recommendations. The author makes no representations as to the accuracy, completeness, or suitability of this information. FXStreet and the author will not be liable for any errors, omissions or any losses, injuries or damages arising from this information and its display or use. Errors and omissions excepted.
The author and FXStreet are not registered investment advisors and nothing in this article is intended to be investment advice.
Recommended content
Editors’ Picks

EUR/USD clings to daily gains near 1.0300 after US PMI data
EUR/USD trades in positive territory at around 1.0300 on Friday. The pair breathes a sigh of relief as the US Dollar rally stalls, even as markets stay cautious amid geopolitical risks and Trump's tariff plans. US ISM PMI improved to 49.3 in December, beating expectations.

GBP/USD holds around 1.2400 as the mood improves
GBP/USD preserves its recovery momentum and trades around 1.2400 in the American session on Friday. A broad pullback in the US Dollar allows the pair to find some respite after losing over 1% on Thursday. A better mood limits US Dollar gains.

Gold retreats below $2,650 in quiet end to the week
Gold shed some ground on Friday after rising more than 1% on Thursday. The benchmark 10-year US Treasury bond yield trimmed pre-opening losses and stands at around 4.57%, undermining demand for the bright metal. Market players await next week's first-tier data.

Stellar bulls aim for double-digit rally ahead
Stellar extends its gains, trading above $0.45 on Friday after rallying more than 32% this week. On-chain data indicates further rally as XLM’s Open Interest and Total Value Locked rise. Additionally, the technical outlook suggests a rally continuation projection of further 40% gains.

Week ahead – US NFP to test the markets, Eurozone CPI data also in focus
King Dollar flexes its muscles ahead of Friday’s NFP. Eurozone flash CPI numbers awaited as euro bleeds. Canada’s jobs data to impact bets of a January BoC cut. Australia’s CPI and Japan’s wages also on tap.

Best Forex Brokers with Low Spreads
VERIFIED Low spreads are crucial for reducing trading costs. Explore top Forex brokers offering competitive spreads and high leverage. Compare options for EUR/USD, GBP/USD, USD/JPY, and Gold.