|

NZD/USD Price Analysis: Defends crucial support of 0.5860

  • NZD/USD bounces back from 0.5860 as the US Dollar edges down.
  • Investors see the RBNZ beginning to reduce interest rates from November.
  • The Kiwi asset trades inside the Descending Triangle pattern, suggesting indecisiveness among investors.

The NZD/USD pair turns sideways slightly below 0.5900 in Friday’s European session after recovering sharply from the crucial support of 0.5860.

The Kiwi asset rebounds as the appeal for risk-perceived currencies strengthens after economists cautioned about persistent global inflation. This has increased speculation that central banks other than the Federal Reserve (Fed) will also delay their rate-cut plans to avoid inflation getting rebound again. Initially, only the Fed was expected to begin reducing interest rates later this year due to stubbornly higher price pressures and robust labor demand.

Investors see the Reserve Bank of New Zealand (RBNZ) pivoting to rate cuts from November after NZ Q1 inflation data grew in line with estimates. Price pressures rose by 0.6% as estimated, higher than the prior reading of 0.5%.

The US Dollar Index (DXY) falls slightly to 106.10. The near-term outlook remains strong as the Federal Reserve (Fed) sees interest rates remaining higher for long enough so that inflation could sustainably return to the desired rate of 2%. Currently, traders see the Fed starting to reduce interest rates from the September meeting.

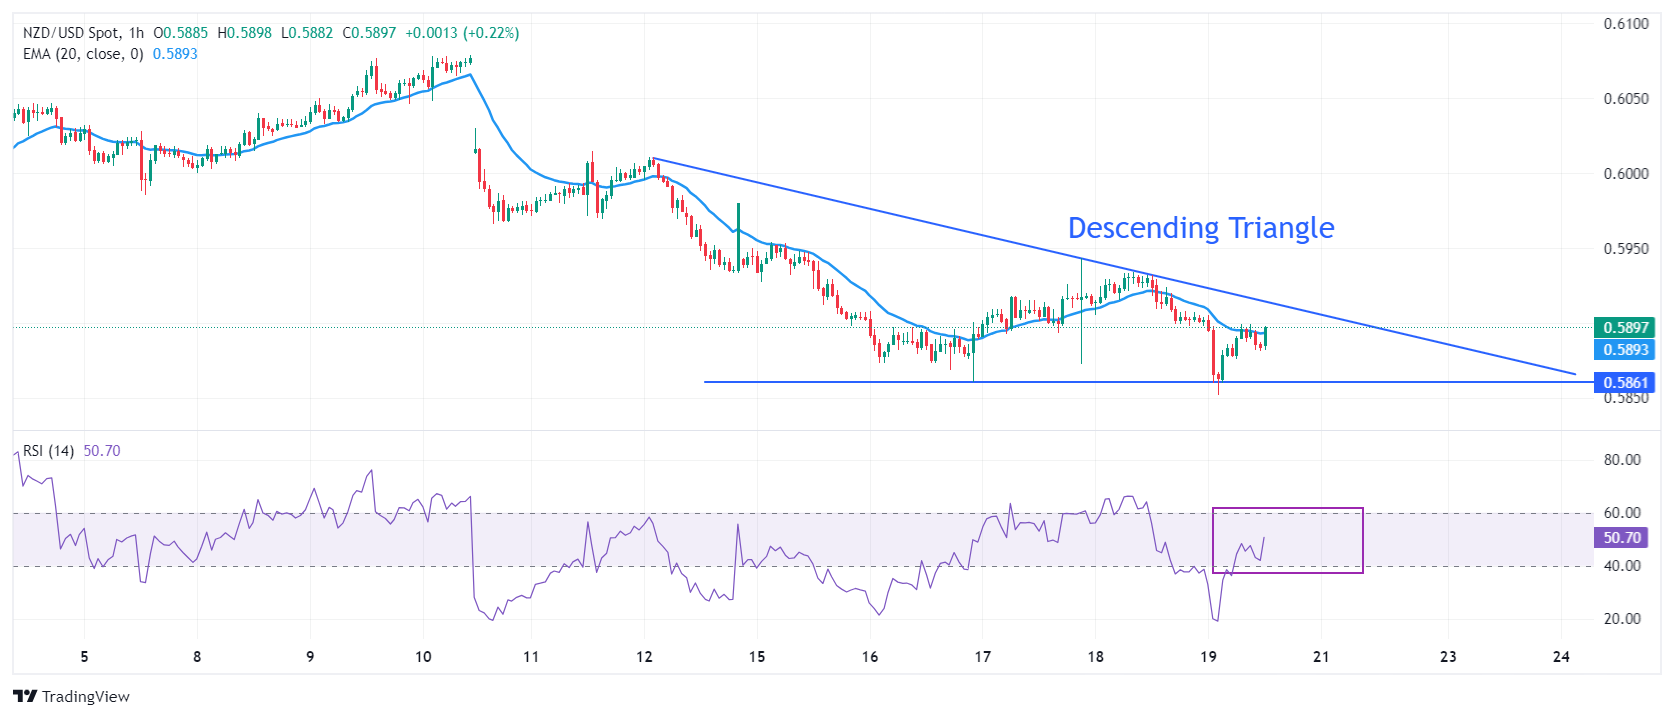
NZD/USD oscillates in a Descending Triangle chart pattern, which exhibits a sharp volatility contraction. The downward-sloping border of the above-mentioned chart pattern is plotted from April 12 high near 0.6000 while the horizontal support is placed from April 16 low at 0.5860.

The Kiwi asset attempts to break above the 20-period Exponential Moving Average (EMA), which trades around 0.5900.

The 14-period Relative Strength Index (RSI) recovers sharply above 40.00. However, the downside bias remains favored until the RSI breaks above 60.00.

Fresh downside would appear if the asset breaks below April 16 low at 0.5860. This would drag the asset toward 8 September 2023 low at 0.5847, followed by the round-level support of 0.5900

On the flip side, a recovery move above March 18 high at 0.6100 will drive the pair toward March 12 low at 0.6135. A breach of the latter will drive the asset further to February 9 high around 0.6160.

NZD/USD hourly chart

NZD/USD

Overview
Today last price0.5899
Today Daily Change-0.0003
Today Daily Change %-0.05
Today daily open0.5902
 
Trends
Daily SMA200.5978
Daily SMA500.6067
Daily SMA1000.6127
Daily SMA2000.6057
 
Levels
Previous Daily High0.5943
Previous Daily Low0.5872
Previous Weekly High0.6079
Previous Weekly Low0.5933
Previous Monthly High0.6218
Previous Monthly Low0.5956
Daily Fibonacci 38.2%0.5899
Daily Fibonacci 61.8%0.5916
Daily Pivot Point S10.5869
Daily Pivot Point S20.5835
Daily Pivot Point S30.5798
Daily Pivot Point R10.594
Daily Pivot Point R20.5977
Daily Pivot Point R30.6011

Author

Sagar Dua

Sagar Dua

FXStreet

Sagar Dua is associated with the financial markets from his college days. Along with pursuing post-graduation in Commerce in 2014, he started his markets training with chart analysis.

More from Sagar Dua
Share:

Editor's Picks

EUR/USD gathers traction, approaches 1.1800

EUR/USD manages to reverse Tuesday’s pullback, advancing to two-day highs near the 1.1800 hurdle in the latter part of Wednesday’s session. The pair’s decent uptick comes on the back of the modest retracement in the US Dollar, as investors continue to closely follow developments on the trade front and news from the White House in the wake of President Trump’s SOTU speech.

GBP/USD challenges multi-day highs near 1.3530

GBP/USD leaves behind the previous day’s decline and regains fresh upside traction on Wednesday, surpassing the 1.3500 barrier in a context of a modest decline in the Greenback and a generalised improved mood in the risk-linked space. Meanwhile, the US tariff narrative continues to dictate the mood among market participants after Presidet Trump’s SOTU speech failed to surprise markets.

Gold remains bid and close to $5,200

Gold buyers are returning to the fold on Wednesday, targeting the $5,200 area and possibly beyond, after Tuesday’s corrective dip from monthly highs. The rebound in the precious metal comes as the US Dollar loses traction, with Trump’s SOTU speech offering little fresh direction and AI-related nerves continuing to ease.

Crypto Today: Bitcoin, Ethereum, XRP test rebound strength as ETF inflows return

Bitcoin, Ethereum and Ripple are gaining traction at the time of writing on Wednesday, amid persistent market doldrums. The Crypto King is up over 2% intraday, trading above $65,000 from the day’s opening of $64,058.

Nvidia earnings to influence AI trade and broader market sentiment

For the last three years, Nvidia has been the engine of the AI boom, and now Wall Street is watching to see whether that momentum can keep going. High-growth stocks have been struggling to maintain their bullish trend in 2026.

Cosmos Hub Price Forecast: ATOM rebounds slightly, bearish outlook remains intact

Cosmos Hub (ATOM) price rebounds, trading above $2.05 at the time of writing on Wednesday, after undergoing a sharp correction since last week. Weakening on-chain and derivatives data support a bearish outlook, while technical analysis remains unfavorable.