|

NZD/USD Price Analysis: Could test psychological level of 0.6100 following February’s high

  • NZD/USD plunges after the RBNZ decides to hold OCR at 5.5%.
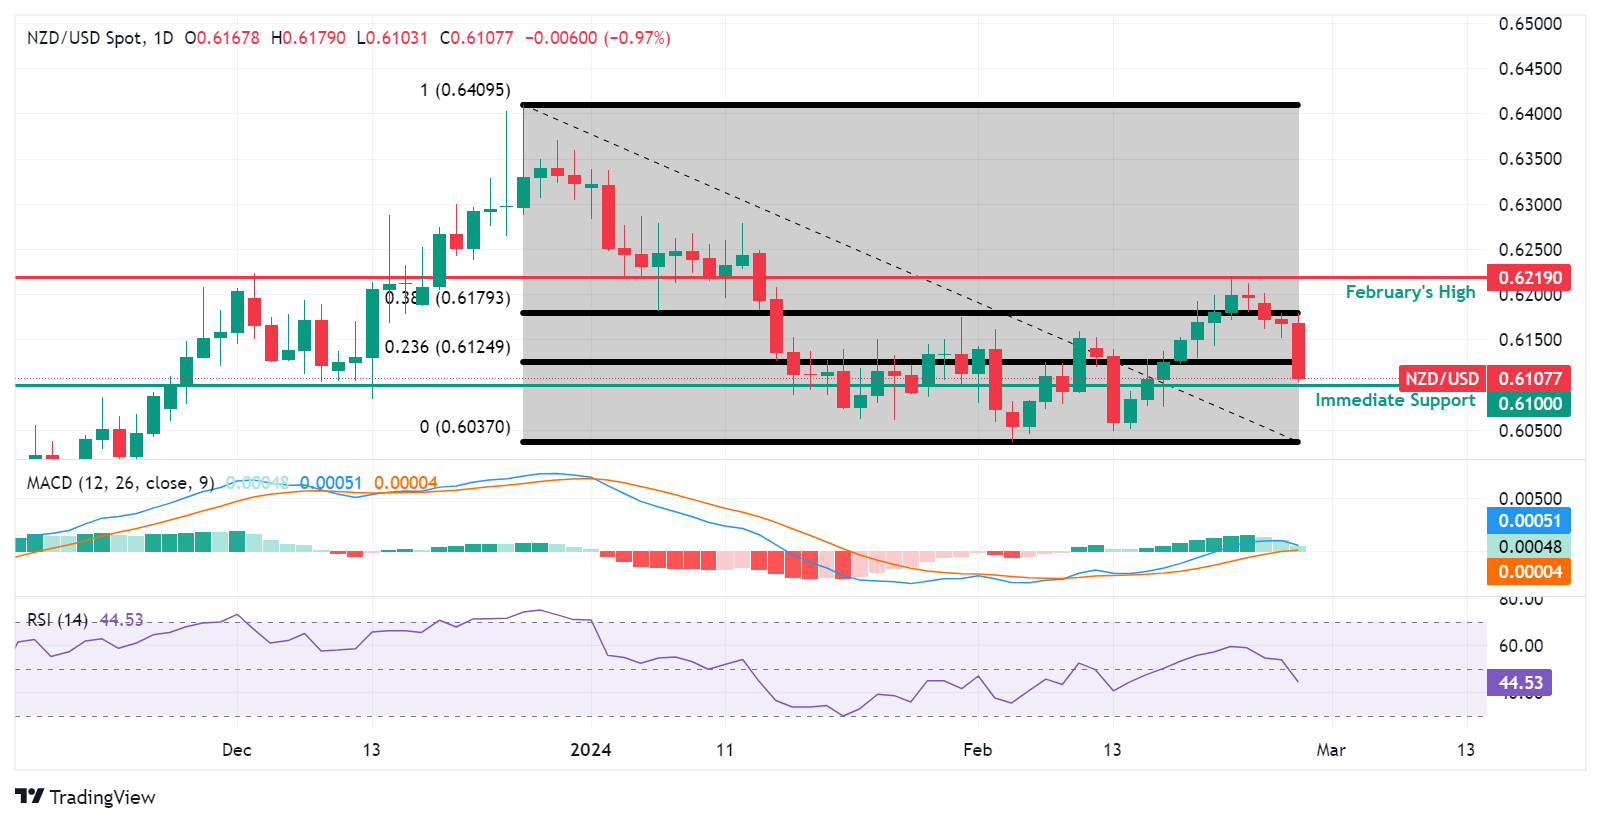
  • A break below 0.6100 could lead the pair to navigate the region around the major support of 0.6050 and February’s low at 0.6037.
  • The immediate resistance appears around the 23.6% Fibonacci retracement level of 0.6124 followed by the major barrier at 0.6150.

NZD/USD extends its losing streak for the fourth consecutive session, plunging to near 0.6110 during the Asian trading hours on Wednesday. The pair faces challenges as the Reserve Bank of New Zealand (RBNZ) decided to hold the Official Cash Rate (OCR) unchanged at 5.5% in its February monetary policy meeting.

The immediate support for the NZD/USD pair is anticipated at the psychological level of 0.6100. A break below this psychological support could put downward pressure on the pair to navigate the region around the major support level of 0.6050 followed by February’s low at 0.6037.

The lagging indicator Moving Average Convergence Divergence (MACD) suggests a momentum shift toward the downward sentiment for the NZD/USD pair. The MACD line is positioned above the centerline but shows convergence above the signal line.

Additionally, the technical analysis of the 14-day Relative Strength Index (RSI) lies below the 50 level, suggesting a bearish sentiment.

On the upside, the NZD/USD pair could find the immediate resistance around the 23.6% Fibonacci retracement level of 0.6124 followed by the major barrier at 0.6150. A breakthrough above this level could lead the pair to explore the resistance zone around the 38.2% Fibonacci retracement level of 0.6179 and the psychological level of 0.6200.

Further improvement of the NZD/USD pair could retest February’s high at 0.6219.

NZD/USD: Daily Chart

NZD/USD

Overview
Today last price0.6106
Today Daily Change-0.0062
Today Daily Change %-1.01
Today daily open0.6168
 
Trends
Daily SMA200.6128
Daily SMA500.6178
Daily SMA1000.6092
Daily SMA2000.6076
 
Levels
Previous Daily High0.6179
Previous Daily Low0.6151
Previous Weekly High0.6219
Previous Weekly Low0.6122
Previous Monthly High0.6339
Previous Monthly Low0.6061
Daily Fibonacci 38.2%0.6162
Daily Fibonacci 61.8%0.6168
Daily Pivot Point S10.6153
Daily Pivot Point S20.6139
Daily Pivot Point S30.6126
Daily Pivot Point R10.6181
Daily Pivot Point R20.6194
Daily Pivot Point R30.6208

Author

Akhtar Faruqui

Akhtar Faruqui is a Forex Analyst based in New Delhi, India. With a keen eye for market trends and a passion for dissecting complex financial dynamics, he is dedicated to delivering accurate and insightful Forex news and analysis.

More from Akhtar Faruqui
Share:

Markets move fast. We move first.

Orange Juice Newsletter brings you expert driven insights - not headlines. Every day on your inbox.

By subscribing you agree to our Terms and conditions.

Editor's Picks

EUR/USD clings to small gains near 1.1750

Following a short-lasting correction in the early European session, EUR/USD regains its traction and clings to moderate gains at around 1.1750 on Monday. Nevertheless, the pair's volatility remains low, with investors awaiting this weeks key data releases from the US and the ECB policy announcements.

GBP/USD edges higher toward 1.3400 ahead of US data and BoE

GBP/USD reverses its direction and advances toward 1.3400 following a drop to the 1.3350 area earlier in the day. The US Dollar struggles to gather recovery momentum as markets await Tuesday's Nonfarm Payrolls data, while the Pound Sterling holds steady ahead of the BoE policy announcements later in the week.

Gold pulls away from session high, holds above $4,300

Gold loses its bullish momentum and retreats below $4,350 after testing this level earlier on Monday. XAU/USD, however, stays in positive territory as the US Dollar remains on the back foot on growing expectations for a dovish Fed policy outlook next year.

Solana consolidates as spot ETF inflows near $1 billion signal institutional dip-buying

Solana price hovers above $131 at the time of writing on Monday, nearing the upper boundary of a falling wedge pattern, awaiting a decisive breakout. On the institutional side, demand for spot Solana Exchange-Traded Funds remained firm, pushing total assets under management to nearly $1 billion since launch. 

Big week ends with big doubts

The S&P 500 continued to push higher yesterday as the US 2-year yield wavered around the 3.50% mark following a Federal Reserve (Fed) rate cut earlier this week that was ultimately perceived as not that hawkish after all. The cut is especially boosting the non-tech pockets of the market.

Solana Price Forecast: SOL consolidates as spot ETF inflows near $1 billion signal institutional dip-buying

Solana (SOL) price hovers above $131 at the time of writing on Monday, nearing the upper boundary of a falling wedge pattern, awaiting a decisive breakout.