|

NZD/USD Price Analysis: Climbs closer to 100-DMA, eyes triangle resistance ahead of NFP

  • NZD/USD attracts fresh buying on Friday and snaps a two-day losing streak.
  • A combination of factors underpins the USD and might cap gains for the pair.
  • The symmetrical triangle formation also warrants caution for bullish traders.
  • The market focus remains glued to the release of the US monthly jobs report.

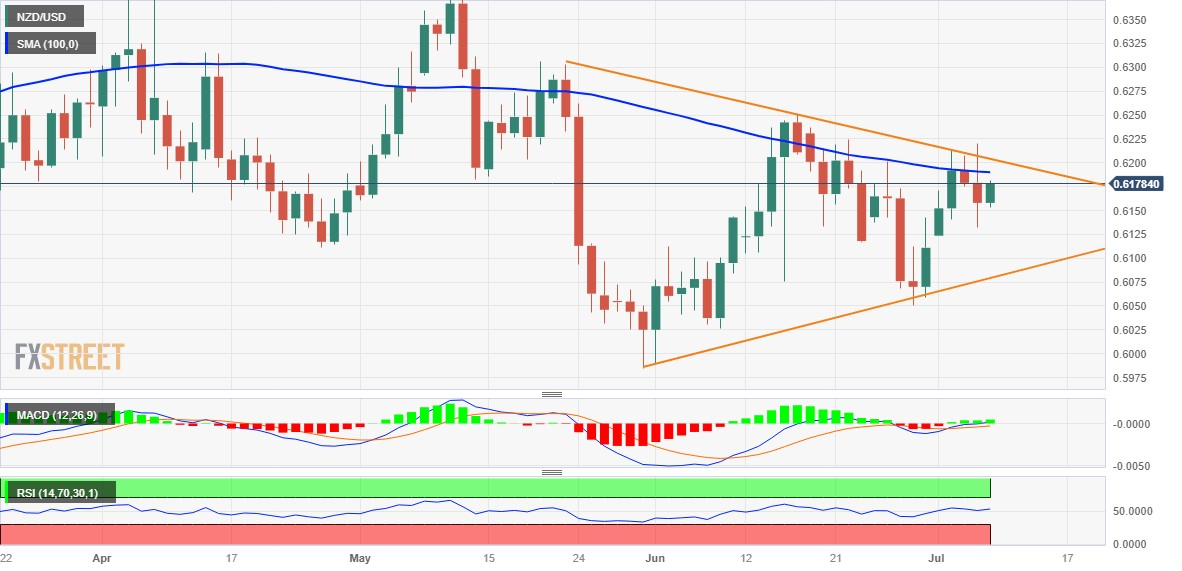
The NZD/USD pair regains positive traction following the previous day's sharp pullback from the 0.6215-0.6220 area, or a two-week high and maintains its bid tone through the early part of the European session. Spot prices currently trade around the 0.6175-0.6180 region, up nearly 0.35% for the day, and for now, seem to have snapped a two-day losing streak.

The intraday move up, meanwhile, lacks any obvious fundamental catalyst and is more likely to remain capped in the wake of the prevalent risk-off environment, which tends to undermine the risk-sensitive. Apart from this, elevated US Treasury bond yields, bolstered by the prospects for further policy tightening by the Federal Reserve (Fed), act as a tailwind for the US Dollar (USD) and might further contribute to capping the NZD/USD pair. Traders might also refrain from placing aggressive bets ahead of the release of the US monthly jobs report, popularly known as the NFP report, due later during the early North American session.

From a technical perspective, spot prices have been oscillating between two converging trend lines since the latter part of May, which constitutes the formation of a symmetrical triangle on the daily chart. Moreover, the recent repeated failures to find acceptance above the 100-day Simple Moving Average (SMA) warrant caution for bulls. Hence, it will be prudent to wait for some follow-through buying and a sustained strength beyond the 0.6200 mark before positioning for any further appreciating move. The NZD/USD pair might then surpass the 0.6235 intermediate hurdle and test the 0.6280-0.6285 supply zone, or the May monthly swing high.

On the flip side, the 0.6140-0.6130 area now seems to protect the immediate downside ahead of the 0.6100 round figure. Any subsequent decline might find decent support near the lower end of the aforementioned triangle, currently pegged around the 0.6070-0.6065 region. A convincing break below will be seen as a fresh trigger for bearish traders and drag the NZD/USD pair to the 0.6000 psychological mark. Some follow-through selling below the YTD low, around the 0.5985 zone should pave the way for further near-term losses.

NZD/USD daily chart

fxsoriginal

Key levels to watch

NZD/USD

Overview
Today last price0.6179
Today Daily Change0.0021
Today Daily Change %0.34
Today daily open0.6158
 
Trends
Daily SMA200.616
Daily SMA500.6169
Daily SMA1000.6189
Daily SMA2000.6171
 
Levels
Previous Daily High0.622
Previous Daily Low0.6132
Previous Weekly High0.6202
Previous Weekly Low0.605
Previous Monthly High0.625
Previous Monthly Low0.599
Daily Fibonacci 38.2%0.6166
Daily Fibonacci 61.8%0.6186
Daily Pivot Point S10.612
Daily Pivot Point S20.6082
Daily Pivot Point S30.6032
Daily Pivot Point R10.6208
Daily Pivot Point R20.6258
Daily Pivot Point R30.6296

Author

Haresh Menghani

Haresh Menghani is a detail-oriented professional with 10+ years of extensive experience in analysing the global financial markets.

More from Haresh Menghani
Share:

Editor's Picks

EUR/USD rebounds from session lows, stays below 1.1650

EUR/USD is recovers modestly from session lows but remains in the red below 1.1650 in European trading on Thursday. The pair faces headwinds from a renewed uptick in the US Dollar amid a negative shift in risk sentiment. Surging energy prices due to the Middle East war keep the bearish pressure intact on the Euro. The US Jobless Claims data are next of note. 

GBP/USD stays weak near 1.3350 amid UK stagflation risks

GBP/USD sticks to losses near 1.3350 in the European session on Thursday. The Pound Sterling loses ground amid fears that the United Kingdom economy could face stagflation risks due to higher energy prices, while the US Dollar attracts fresh havem demand ahead of the US Jobless Claims data. 

Gold climbs near $5,200 as Iran war fuels safe-haven demand

Gold price extends its gains for the second successive session on Thursday as traders seek safety amid the ongoing war in the Middle East. US and Israeli strikes across Iranian territory and widespread Iranian missile and drone retaliation across the Middle East, including attacks on regional targets and military sites, prolong the crisis and its impact.

Three reasons to be bearish on Bitcoin

Bitcoin is holding up well taking into account the uncertainty stemming from the Middle East. Despite this week’s rally, the long-term outlook remains bearish. Here are three reasons why I think the storm for the largest cryptocurrency isn't over yet.

FX alert: When Energy still writes the macro script the Dollar holds the pen

The market is quietly sliding back into the trade nobody wanted to own, but everyone now has to respect again. The no quick off-ramp trade. Yesterday’s bounce in risk assets already looks less like a turning point and more like a classic relief rally in a market that briefly inhaled before realizing the room was still on fire.

Cardano Price Analysis: Approaches key trendline amid bearish sentiment

Cardano (ADA) price is approaching its descending trendline around $0.28 at the time of writing, set to shape the next directional move. The derivatives metrics paint a bearish picture, with ADA’s Open Interest continuing to fall and short bets rising among traders.