|

NZD/USD Price Analysis: Bulls eye a significant correction to the upside

  • NZD/USD bulls in the market and eye a move to test resistances. 
  • The weekly M-formation is a compelling feature in this regard. 

New Zealand Dollars rebounded from earlier dips on Monday, helped by China's data showing an accelerated recovery in the services sector. Additionally, the surprise hawkish decision from the Reserve Bank of Australia (RBA) has tugged the Bird along as well. At the time of writing, NZD/USD has rallied from the week´s peak low area finding support around the 0.6050s. 

The following will illustrate the bias for an upside move on Wednesday:

NZD/USD weekly chart

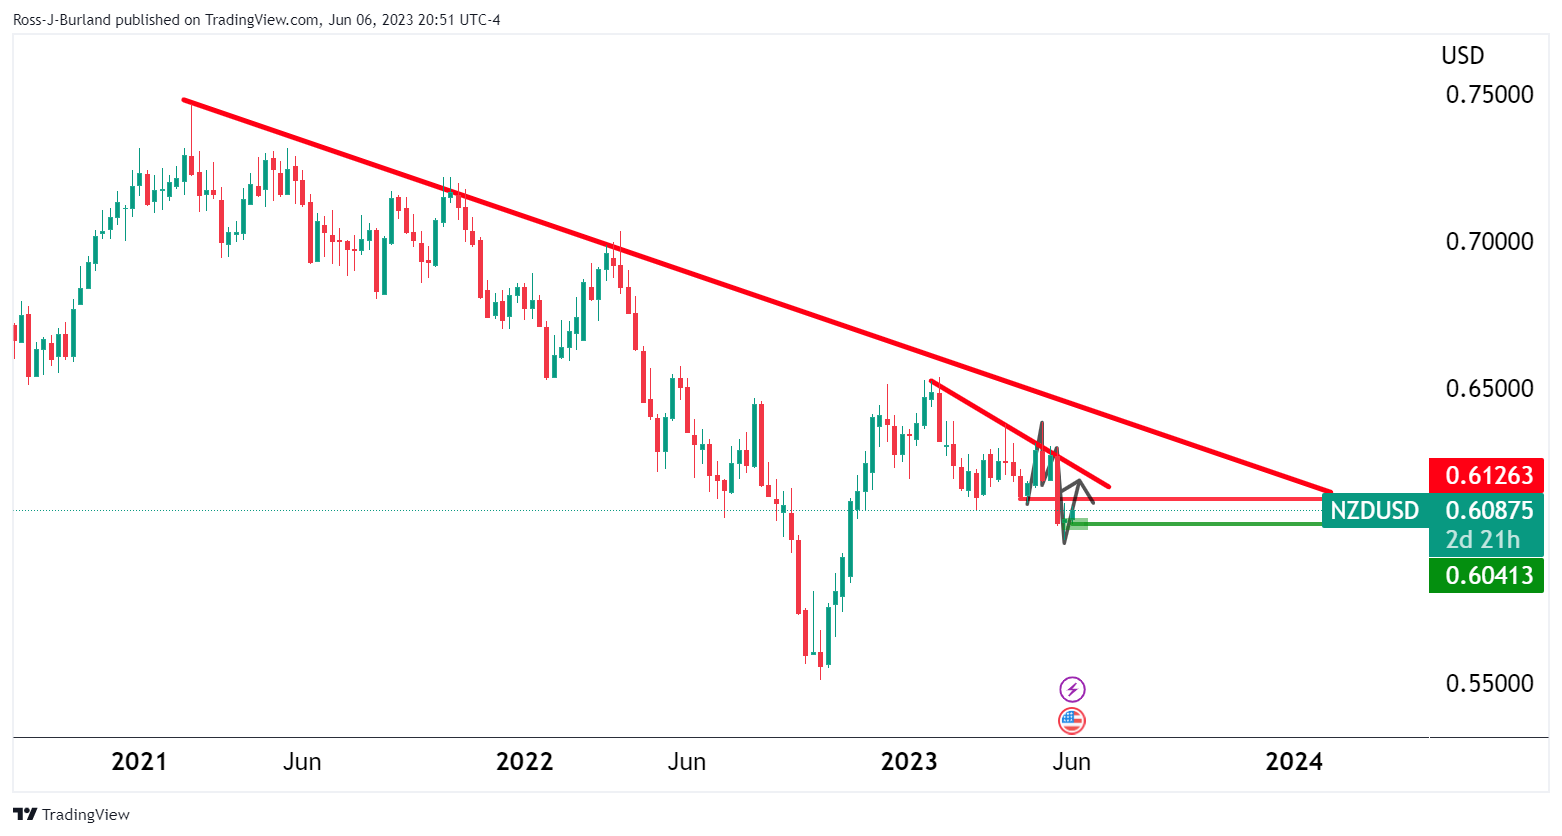
The weeklñy M-formation is compelling. This is a reversion pattern and the bulls are moving in for a target toward the neckline and a 61.8% Fibonacci. This meets the trenmdlñine resistance as well. 
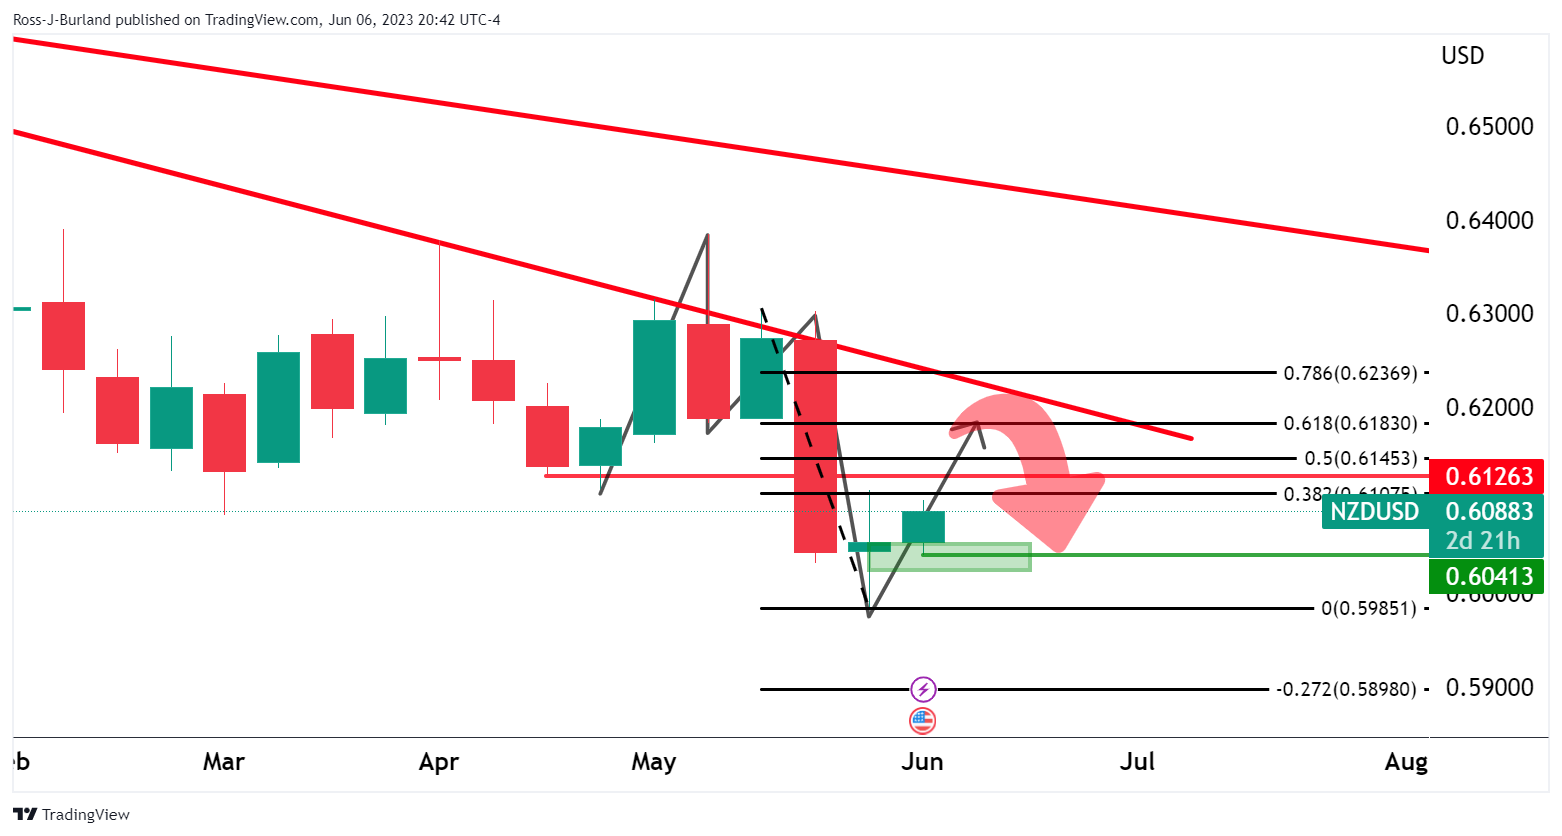
NZD/USD daily chart

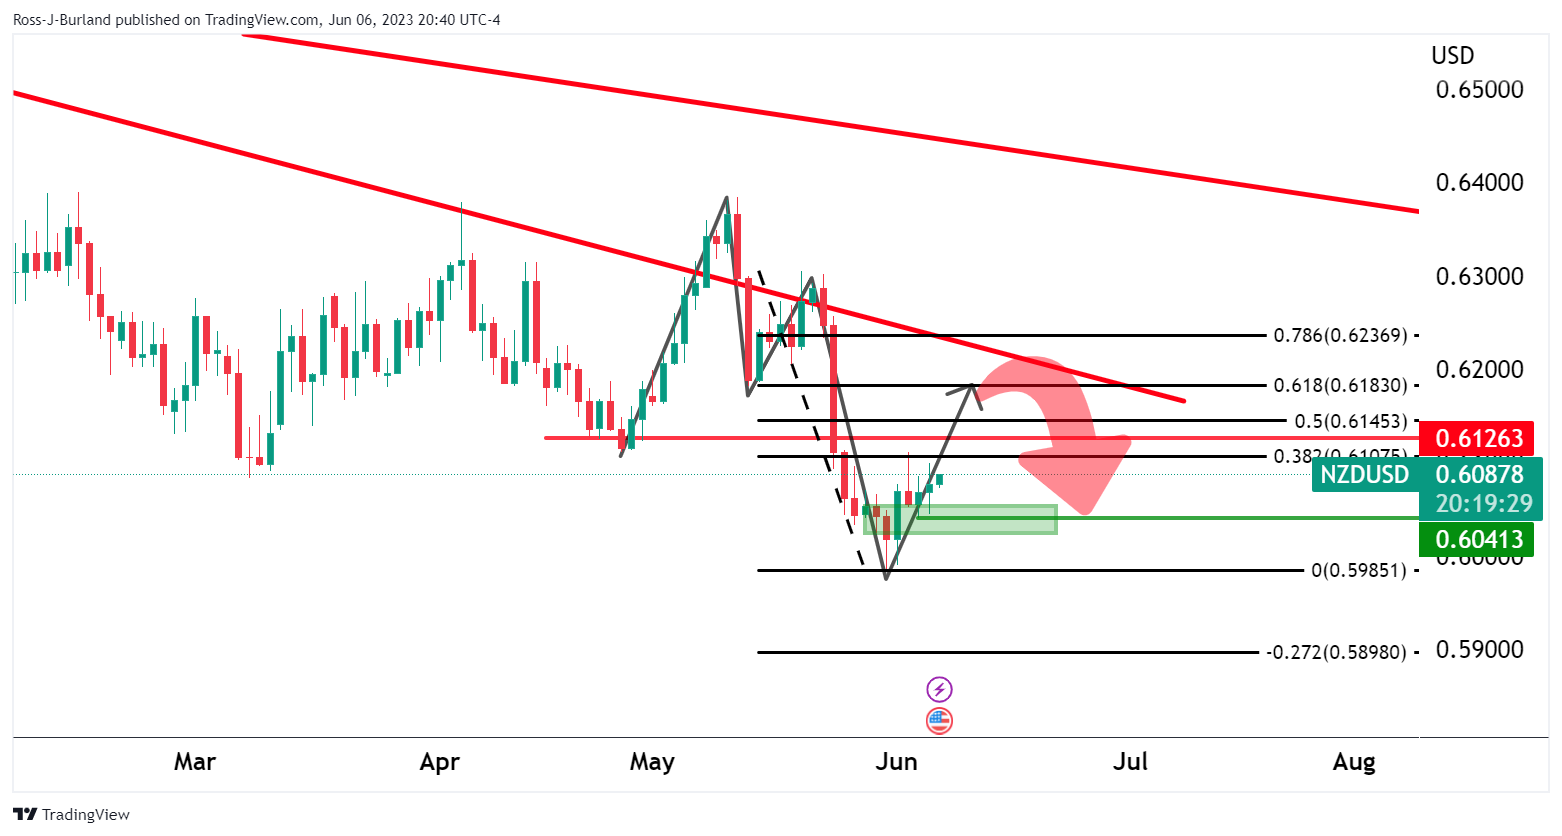
The daily chart aligns with the bullish bias as for the support area that is holding so far:

The correction was a 50% mean reversion that has held the test of time and bulls stay in control. 

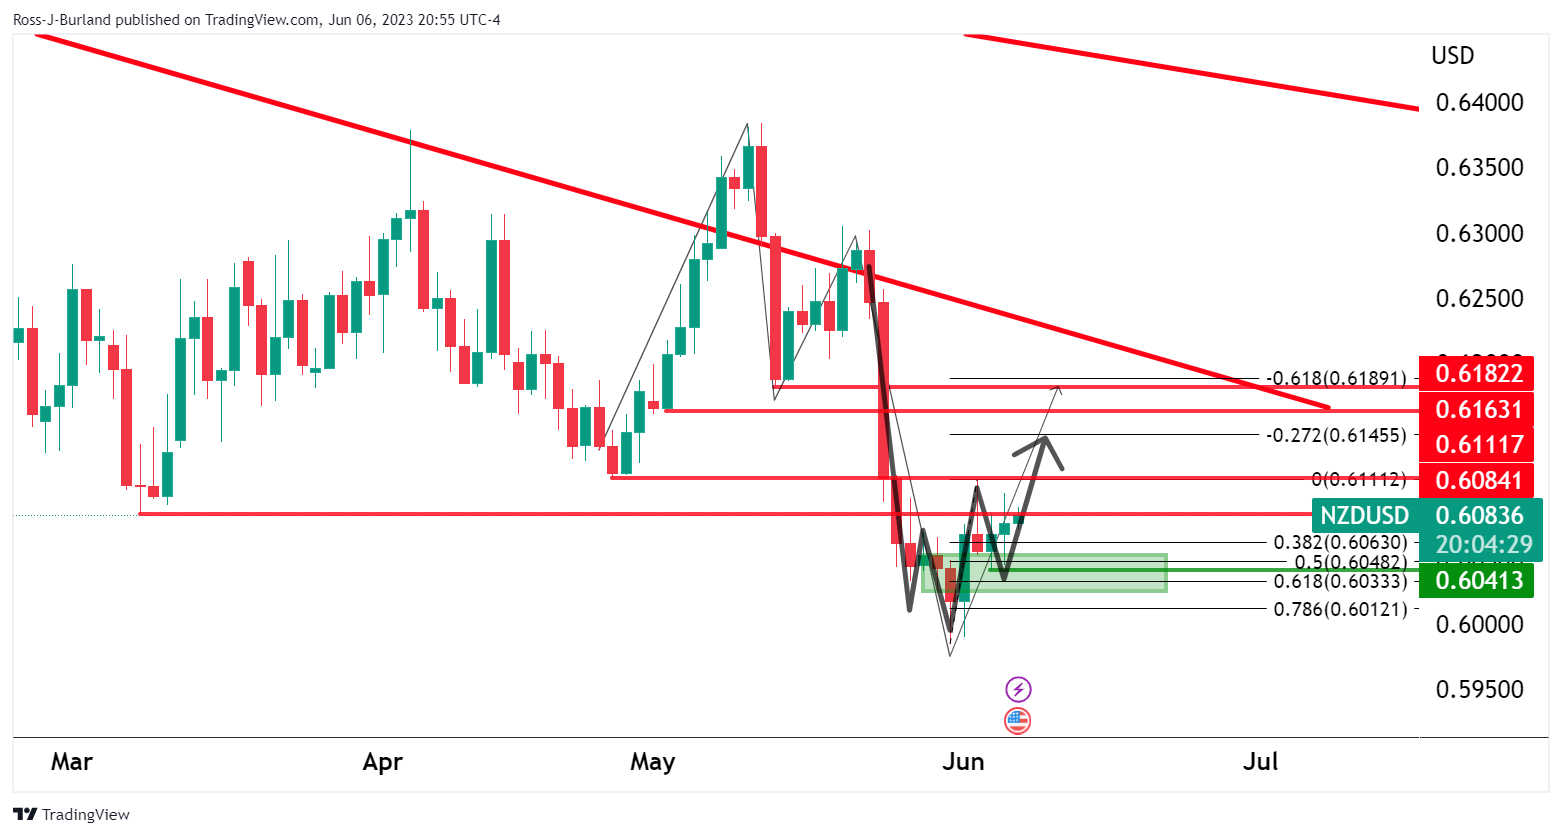
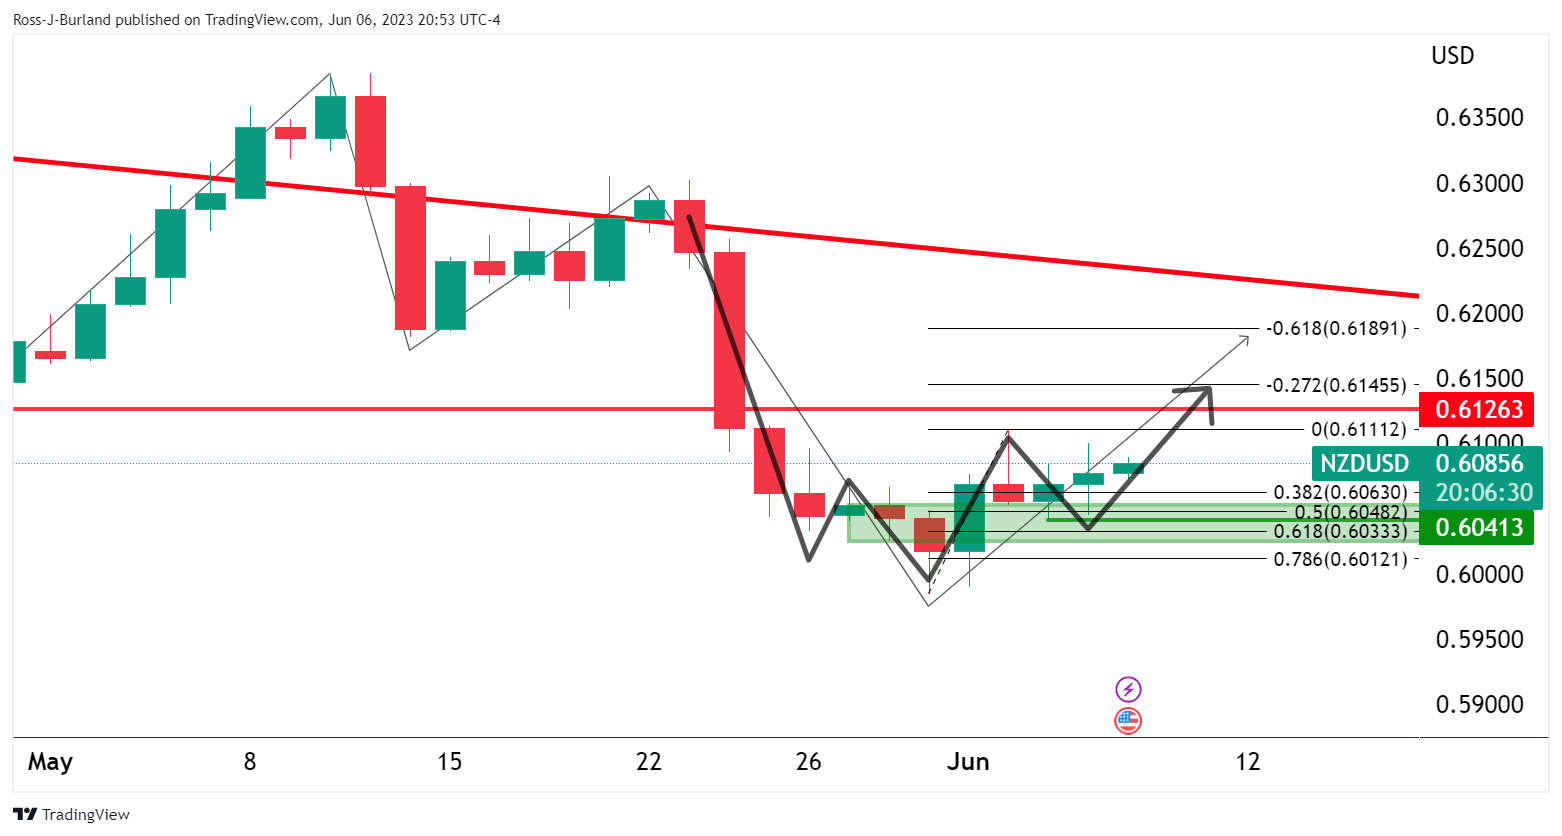
The levels to watch on the upside are highlighted above. 

Author

Ross J Burland

Ross J Burland, born in England, UK, is a sportsman at heart. He played Rugby and Judo for his county, Kent and the South East of England Rugby team.

More from Ross J Burland
Share:

Editor's Picks

EUR/USD looks apathetic around 1.1770

EUR/USD comes under renewed pressure on Tuesday, deflating below the 1.1800 support and reversing two consecutive days of gains. The pair’s decline follows the persistent move higher in the US Dollar, as trade uncertainty dominates the sentiment ahead of President Trump’s SOTU speech.

GBP/USD regains 1.3500 and above

GBP/USD extends its advance for the third day in a row on Tuesday, this time retesting the area beyond the 1.3500 hurdle. Cable’s uptick comes despite decent gains in the Greenback and the dovish message from the BoE’s Bailey at the UK Parliament.

Gold appears offered around $5,150

Gold is giving back a good portion of the recent multi-day rally, receding to the $5,150 zone per troy ounce amid the decent bounce in the US Dollar and mixed US Treasuty yields. In the meantime, markets’ attention remain on upcoming comments from Fed speakers.

Ripple’s DeFi shift in focus: Navigating XRPL EVM sidechain growth, XRPFi migration and liquidity

Ripple (XRP) has continued to trade under pressure, extending its decline by approximately 63% from the record high of $3.66 in July. The remittance token is trading above support at $1.35, while its upside appears limited by key supply zones, starting with $1.40, at the time of writing on Tuesday.

The Citrini report: How a debatable AI narrative can shake Wall Street

That AI-related headline alone was enough to rattle investors.US stocks slid sharply on Monday after a widely circulated Citrini Research memo outlined a hypothetical “2028 Global Intelligence Crisis”, warning that rapid AI adoption could push US unemployment into double digits as early as by mid-2028.

XRP pressured by weak ETF flows and declining retail interest

Ripple (XRP) is edging lower, trading above its intraday low of $1.32 at the time of writing on Tuesday. The decline from its weekly opening of $1.39 reflects heightened volatility in the broader cryptocurrency market, accentuated by tariff-triggered uncertainty.