NZD/USD Price Analysis: Bullish sentiment maintains despite softening momentum


  • Despite softening positive momentum indicated by the daily MACD, the overall trend still favors the buyers.
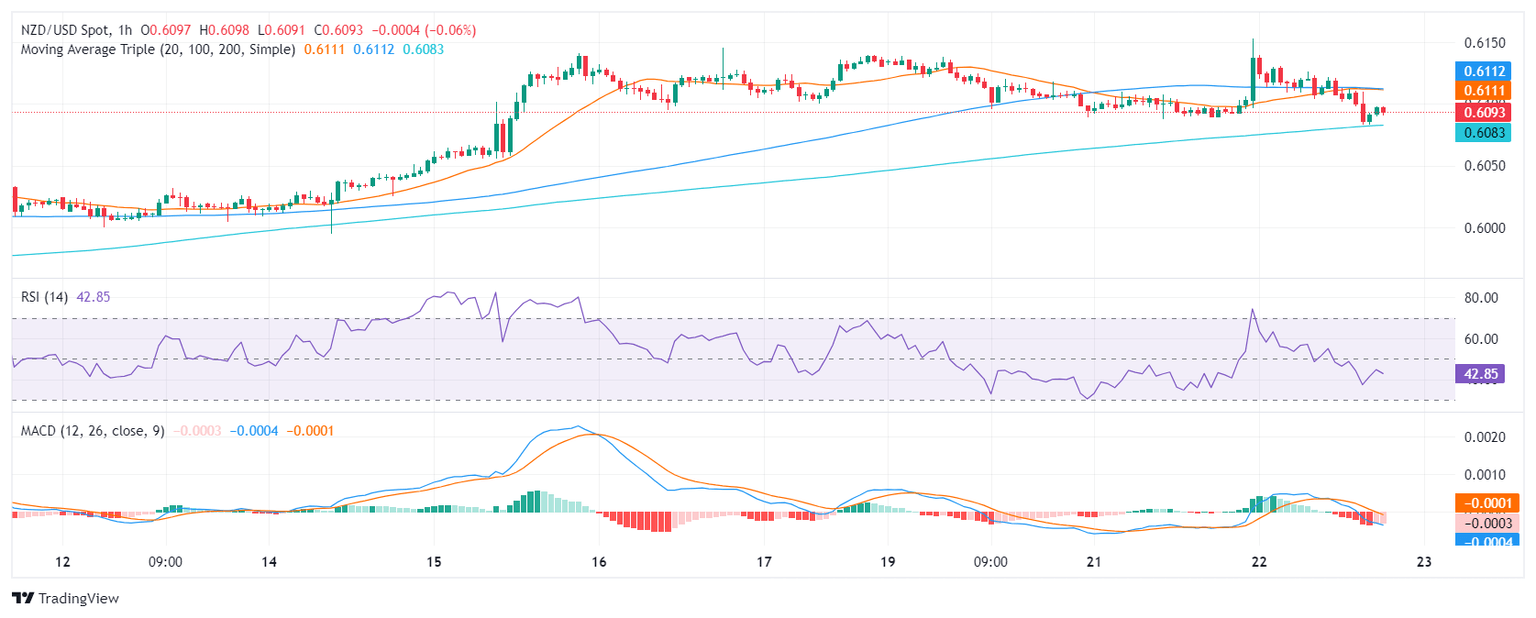
  • Hourly chart shows fairly neutral RSI but negative momentum in MACD, signaling possible short-term fluctuations.
  • Regardless of potential shifts suggested by hourly indicators, the overall bullish bias based on daily SMAs is intact.
  • Signs of weakening buying momentum in NZD/USD implies potential retests of key SMAs, dictating investor alertness.

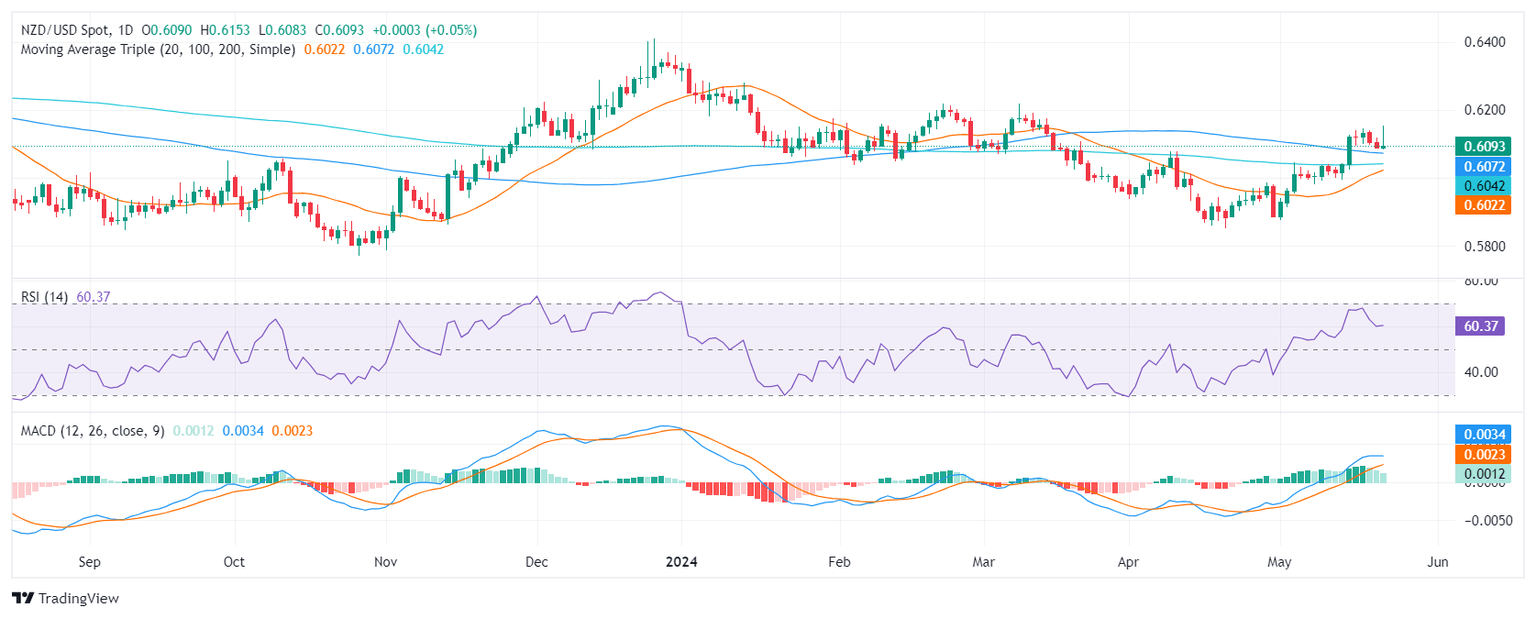
On Wednesday's session, the NZD/USD showed diminishing buying traction and fell just below 0.6100. However, the short-term outlook will be positive if the pair maintains its position over new reference points set by 100 and 200-day Simple Moving Averages (SMAs). If lost, the bears might step in aggressively.

Examining the daily chart, the Relative Strength Index (RSI) exhibits a positive but flattening trend, with its most recent reading of 60. Simultaneously, the Moving Average Convergence Divergence (MACD) displays decreasing green bars indicating a slight softening of positive momentum.

NZD/USD daily chart

Focusing on the hourly view, the RSI has moderately adjusted with the latest reading of 41, reflecting a fairly neutral direction. Notably, the MACD histogram has produced consistently flat red bars, signaling negative momentum on an intraday basis.

NZD/USD hourly chart

In conclusion, investors seem to be taking profits and, should the pair hold above the recently-conquered 100 and 200-day Simple Moving Averages (SMAs), any downward movement should not necessarily be considered a selling signal. However, buying traction appears to be waning, and the pair is set for a retest of the mentioned SMAs.


NZD/USD

Overview
Today last price 0.6093
Today Daily Change 0.0003
Today Daily Change % 0.05
Today daily open 0.609
 
Trends
Daily SMA20 0.6014
Daily SMA50 0.6004
Daily SMA100 0.6074
Daily SMA200 0.6041
 
Levels
Previous Daily High 0.6118
Previous Daily Low 0.6087
Previous Weekly High 0.6146
Previous Weekly Low 0.5995
Previous Monthly High 0.6079
Previous Monthly Low 0.5851
Daily Fibonacci 38.2% 0.6099
Daily Fibonacci 61.8% 0.6106
Daily Pivot Point S1 0.6079
Daily Pivot Point S2 0.6068
Daily Pivot Point S3 0.6049
Daily Pivot Point R1 0.6109
Daily Pivot Point R2 0.6129
Daily Pivot Point R3 0.614


Share: Feed news

Information on these pages contains forward-looking statements that involve risks and uncertainties. Markets and instruments profiled on this page are for informational purposes only and should not in any way come across as a recommendation to buy or sell in these assets. You should do your own thorough research before making any investment decisions. FXStreet does not in any way guarantee that this information is free from mistakes, errors, or material misstatements. It also does not guarantee that this information is of a timely nature. Investing in Open Markets involves a great deal of risk, including the loss of all or a portion of your investment, as well as emotional distress. All risks, losses and costs associated with investing, including total loss of principal, are your responsibility. The views and opinions expressed in this article are those of the authors and do not necessarily reflect the official policy or position of FXStreet nor its advertisers. The author will not be held responsible for information that is found at the end of links posted on this page.

If not otherwise explicitly mentioned in the body of the article, at the time of writing, the author has no position in any stock mentioned in this article and no business relationship with any company mentioned. The author has not received compensation for writing this article, other than from FXStreet.

FXStreet and the author do not provide personalized recommendations. The author makes no representations as to the accuracy, completeness, or suitability of this information. FXStreet and the author will not be liable for any errors, omissions or any losses, injuries or damages arising from this information and its display or use. Errors and omissions excepted.

The author and FXStreet are not registered investment advisors and nothing in this article is intended to be investment advice.

Pepperstone
Sponsor
Account
8.2
Tools
8.2
Service
7.4
Trading
9
Trust
8.8
Experience
9
Read Review
Account
7.2
Tools
9.2
Service
9.6
Trading
8.4
Trust
7
Experience
8.4
Read Review
Account
7.4
Tools
6.6
Service
8
Trading
6.6
Trust
5.2
Experience
9.2
Read Review
Pepperstone
Sponsor
Account
8.2
Tools
8.2
Service
7.4
Trading
9
Trust
8.8
Experience
9
Read Review
Account
7.2
Tools
9.2
Service
9.6
Trading
8.4
Trust
7
Experience
8.4
Read Review
Account
7.4
Tools
6.6
Service
8
Trading
6.6
Trust
5.2
Experience
9.2
Read Review

Recommended content


Recommended content

Editors’ Picks

GBP/USD stays pressured below 1.3300 after UK Retail Sales data

GBP/USD stays pressured below 1.3300 after UK Retail Sales data

GBP/USD remains under moderate selling pressure below 1.3300 despite the upbeat UK Retail Sales data for March. The pair feels the heat of the solid US Dollar rebound, aided by a Bloomberg report, which indicated China may suspend its 125% tariff on select US imports. 

GBP/USD News
EUR/USD slides toward 1.1300 as US Dollar jumps on US-China trade optimism

EUR/USD slides toward 1.1300 as US Dollar jumps on US-China trade optimism

EUR/USD extends the drop toward 1.1300 in European trading on Friday. Broad US Dollar resurgence on optimism surrounding the US-China trade war de-escalation weighs heavily on the pair. Trade talks and US data remain in focus. 

EUR/USD News
Gold price drifts lower as US-China trade deal hopes undermine safe-haven assets

Gold price drifts lower as US-China trade deal hopes undermine safe-haven assets

Gold price bulls seem reluctant as a positive risk tone undermines demand for safe-haven assets. Thursday’s upbeat US macro data supports the USD, contributing to capping the precious metal. Geopolitical uncertainties and Fed rate cut bets should help limit losses for the XAU/USD pair.

Gold News
Ethereum: Accumulation addresses grab 1.11 million ETH as bullish momentum rises

Ethereum: Accumulation addresses grab 1.11 million ETH as bullish momentum rises

Ethereum saw a 1% decline on Friday as sellers dominated exchange activity in the past 24 hours. Despite the recent selling, increased inflows into accumulation addresses and declining net taker volume show a gradual return of bullish momentum.

Read more
Five fundamentals for the week: Traders confront the trade war, important surveys, key Fed speech

Five fundamentals for the week: Traders confront the trade war, important surveys, key Fed speech Premium

Will the US strike a trade deal with Japan? That would be positive progress. However, recent developments are not that positive, and there's only one certainty: headlines will dominate markets. Fresh US economic data is also of interest.

Read more
The Best brokers to trade EUR/USD

The Best brokers to trade EUR/USD

SPONSORED Discover the top brokers for trading EUR/USD in 2025. Our list features brokers with competitive spreads, fast execution, and powerful platforms. Whether you're a beginner or an expert, find the right partner to navigate the dynamic Forex market.

Read More

Forex MAJORS

Cryptocurrencies

Signatures

Best Brokers of 2025