|

NZD/USD Price Analysis: brief pullback questions 20-day SMA support

  • NZD/USD fell at the end of the weekresting around 0.5590 after struggling to sustain previous gains.
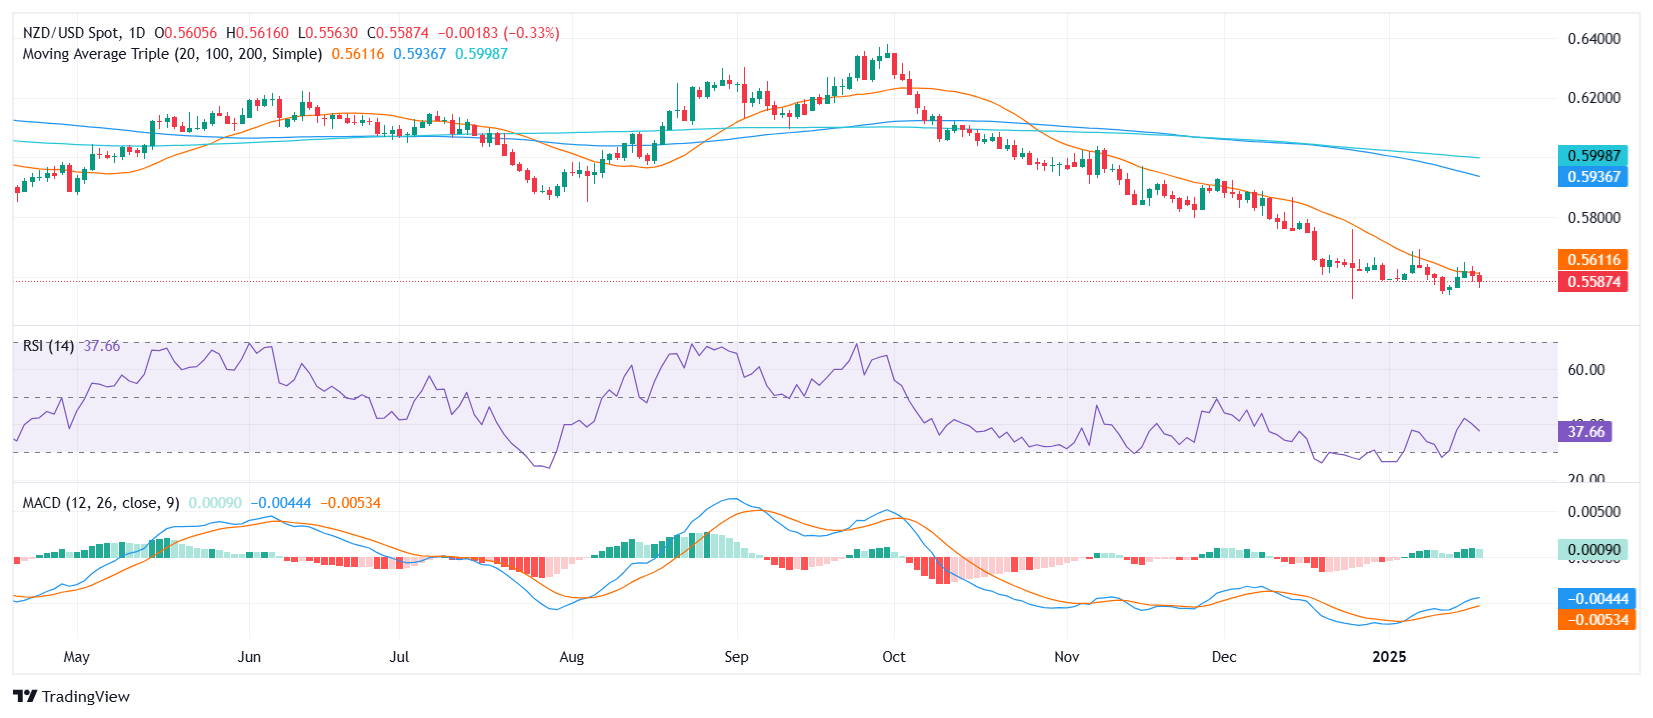
  • RSI plunges to 40 in negative territory, pointing to weakening momentum as sellers regain confidence.
  • MACD histogram shows rising green bars, hinting that not all bullish interest has faded despite the drop.

The NZD/USD pair lost ground on Friday, sliding 0.30% to settle near 0.5590. This downturn casts doubt on the sustainability of the pair’s recent consolidation above its 20-day Simple Moving Average (SMA), a region that might still offer a line of defense for buyers hoping to maintain upward traction. With sellers beginning to chip away at gains seen earlier in the week, it remains uncertain whether the pair can cling to its fragile support zone.

From a technical perspective, momentum readings are mixed. The Relative Strength Index (RSI) has retreated sharply to 40, underscoring a renewed bout of bearish pressure. Meanwhile, the Moving Average Convergence Divergence (MACD) histogram continues to produce green bars, suggesting that some underlying bullish sentiment persists but in a less confident manner. These conflicting signals underscore the delicate nature of the current price action.

Should NZD/USD consolidate effectively near the 20-day SMA, now around the 0.5600 mark, buyers may attempt another push higher, with 0.5630 serving as an interim hurdle before a potential run at 0.5650. Conversely, a decisive breach below 0.5580 would likely hand control back to the bears, exposing lower targets near the 0.5550 region and undermining the pair’s nascent support base.

NZD/USD daily chart

Author

Patricio Martín

Patricio is an economist from Argentina passionate about global finance and understanding the daily movements of the markets.

More from Patricio Martín
Share:

Editor's Picks

EUR/USD flirts with daily highs, retargets 1.1900

EUR/USD regains upside traction, returning to the 1.1880 zone and refocusing its attention to the key 1.1900 barrier. The pair’s slight gains comes against the backdrop of a humble decline in the US Dollar as investors continue to assess the latest US CPI readings and the potential Fed’s rate path.

GBP/USD remains well bid around 1.3650

GBP/USD maintains its upside momentum in place, hovering around daily highs near 1.3650 and setting aside part of the recent three-day drop. Cable’s improved sentiment comes on the back of the Greenback’s  irresolute price action, while recent hawkish comments from the BoE’s Pill also collaborate with the uptick.

Gold clings to gains just above $5,000/oz

Gold is reclaiming part of the ground lost on Wednesday’s marked decline, as bargain-hunters keep piling up and lifting prices past the key $5,000 per troy ounce. The precious metal’s move higher is also underpinned by the slight pullback in the US Dollar and declining US Treasury yields across the curve.

Crypto Today: Bitcoin, Ethereum, XRP in choppy price action, weighed down by falling institutional interest 

Bitcoin's upside remains largely constrained amid weak technicals and declining institutional interest. Ethereum trades sideways above $1,900 support with the upside capped below $2,000 amid ETF outflows.

Week ahead – Data blitz, Fed Minutes and RBNZ decision in the spotlight

US GDP and PCE inflation are main highlights, plus the Fed minutes. UK and Japan have busy calendars too with focus on CPI. Flash PMIs for February will also be doing the rounds. RBNZ meets, is unlikely to follow RBA’s hawkish path.

Ripple Price Forecast: XRP potential bottom could be in sight

Ripple edges up above the intraday low of $1.35 at the time of writing on Friday amid mixed price actions across the crypto market. The remittance token failed to hold support at $1.40 the previous day, reflecting risk-off sentiment amid a decline in retail and institutional sentiment.