|

NZD/USD Price Analysis: Battles key resistance lines around 0.6650

  • NZD/USD struggles between monthly and three-week-old descending trend lines.
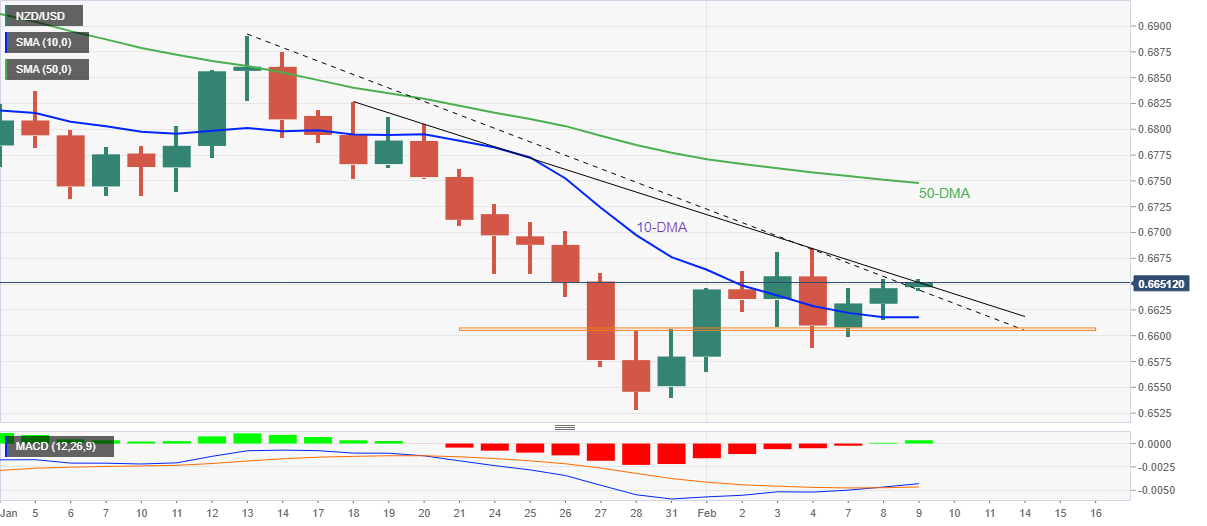
  • Bullish cross of the MACD line, sustained trading above 10-DMA favor buyers.
  • Early January lows, 50-DMA could lure bulls, weekly horizontal support limit pullback moves.

NZD/USD bulls fail to cheer the one-month-old trend line breakout near 0.6650 during the third positive day amid Wednesday’s Asian session.

Although bullish MACD signals and clear trading beyond the 10-DMA keeps NZD/USD buyers hopeful, a sustained run-up beyond the descending trend line from January 18, around 0.6655, becomes necessary to justify the recent breakout of the monthly resistance line.

Following that, early January month’s low and 50-DMA, respectively near 0.6735 and 0.6750, will be in focus.

Alternatively, pullback moves remain elusive beyond the resistance-turned-support line near 0.6645.

Also restricting short-term NZD/USD declines is the 10-DMA and one-week-long horizontal area, around 0.6615 and 0.6605, in that order.

To sum up, NZD/USD grinds higher amid a quiet Asian session, with buyers having an upper hand.

NZD/USD: Daily chart

Trend: Further upside expected

Additional important levels

Overview
Today last price0.6649
Today Daily Change0.0003
Today Daily Change %0.05%
Today daily open0.6646
 
Trends
Daily SMA200.6695
Daily SMA500.6751
Daily SMA1000.6889
Daily SMA2000.698
 
Levels
Previous Daily High0.6655
Previous Daily Low0.6615
Previous Weekly High0.6684
Previous Weekly Low0.654
Previous Monthly High0.6891
Previous Monthly Low0.6529
Daily Fibonacci 38.2%0.664
Daily Fibonacci 61.8%0.663
Daily Pivot Point S10.6623
Daily Pivot Point S20.6599
Daily Pivot Point S30.6583
Daily Pivot Point R10.6662
Daily Pivot Point R20.6679
Daily Pivot Point R30.6702

Author

Anil Panchal

Anil Panchal

FXStreet

Anil Panchal has nearly 15 years of experience in tracking financial markets. With a keen interest in macroeconomics, Anil aptly tracks global news/updates and stays well-informed about the global financial moves and their implications.

More from Anil Panchal
Share:

Editor's Picks

EUR/USD looks weak below 1.1800

EUR/USD has slipped back under pressure, breaking through the 1.1800 support and drifting towards the weekly lows near 1.1770 ahead of the opening bell in Asia. The move reflects renewed strength in the US Dollar, with steady geopolitical tensions keeping its demand firm. Moving forward, the release of the German labour market report and flash inflation figures should keep European investors entertained on Friday.
 

GBP/USD threatens the 200-day SMA near 1.3440

GBP/USD rapidly leaves behind Wednesday’s strong advance, coming under heavy pressure and retesting the 1.3440 zone, where the critical 200-day SMA is located. Cable’s deep pullback follows the strong gains in the Greenback, while investors continue to pencil in a potential BoE rate cut in March.

Gold trims gains, slips back to around $5,170

Gold is now facing some downside pressure, hovering around the $5,170 region on Thursday. The yellow metal surrenders part of its earlier gains on the back of the resurgence of the buying interest in the Greenback. In the meantime, geopolitical tensions in the Middle East continue to limit the downside potential for now.

How AI, blockchain, stablecoins are shaping a new global economy – Circle CEO Jeremy Allaire

Artificial Intelligence (AI), blockchain technology and stablecoins are emerging as core pillars of a new global economic system, according to Circle’s CEO, Jeremy Allaire.

Changing the game: International implications of recent tariff developments

The Supreme Court ruling on International Emergency Economic Powers Act (IEEPA) tariffs provides limited relief for the rest of the world, with weighted average tariff rates modestly lower.

Bitcoin steadies as traders eye US–Iran talks

Bitcoin (BTC) price is stabilizing around $68,000 at the time of writing on Thursday after a 6.2% relief rally the previous day amid a broader downward trend.