|

NZD/USD Price Analysis: Approaches 0.6480 hurdle on overall positive China inflation report

  • NZD/USD prints four-day uptrend after China’s November month inflation data.
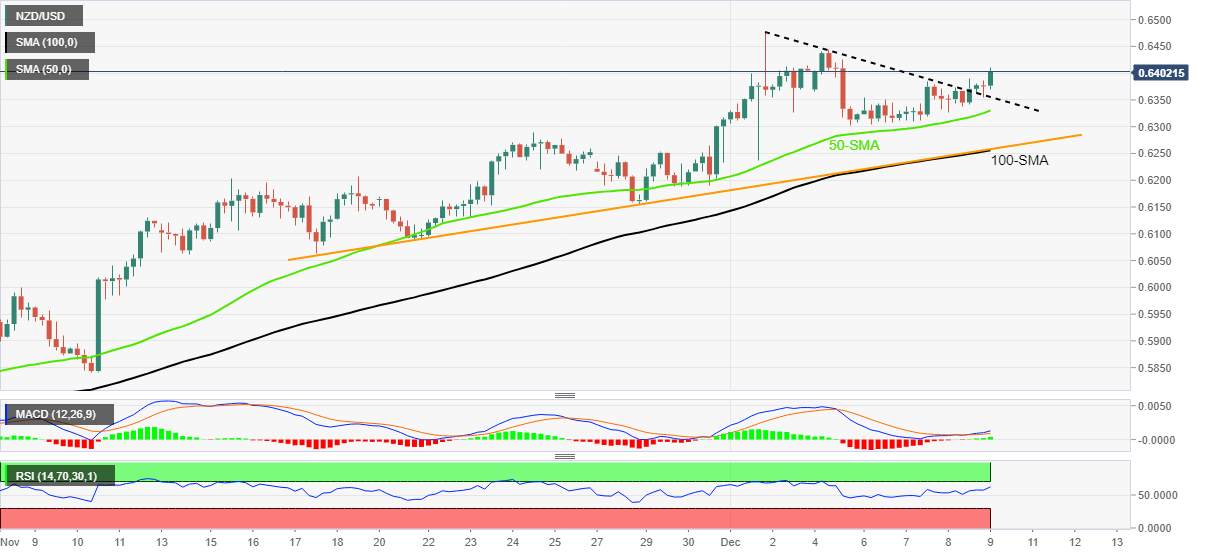
  • Clear upside break of one-week-old descending trend line favor buyers.
  • Convergence of 100-SMA, fortnight-old support line restricts bear’s entry.

NZD/USD takes the bids to refresh the daily high near 0.6410 during the four-day uptrend on early Friday. The Kiwi pair’s latest gains could be linked to China’s monthly inflation data, as well as the technical breakout.

That said, China’s headline Consumer Price Index (CPI) dropped to -0.2% MoM during November versus 0.1% expected and prior. However, the yearly figures came in firmer, to 1.6% versus 1.0% market forecast and 2.1% prior. On the same line was the Producer Price Index (PPI) which improved to -1.3% YoY during the stated month despite -1.5% forecasts and -1.3% previous readings.

It should be noted that the NZD/USD pair’s sustained break of a two-week-long descending trend line joins firmer RSI and bullish MACD signals to keep buyers directed towards the monthly high near 0.6480.

In a case where the NZD/USD bulls dominate past 0.6480, the 0.6500 round figure and June’s peak near 0.6575 could flash on their radars.

Alternatively, the resistance-turned-support line, around 0.6355 by the press time, precedes the 50-SMA level of 0.6330 to restrict the short-term NZD/USD downside.

However, a convergence of the 100-SMA and an upward-sloping trend line from November 21, near 0.6255, appears a tough nut to crack for the Kiwi pair bears and holds the key for their entry.

NZD/USD: Four-hour chart

Trend: Further upside expected

Additional important levels

Overview
Today last price0.6406
Today Daily Change0.0025
Today Daily Change %0.39%
Today daily open0.6381
 
Trends
Daily SMA200.6232
Daily SMA500.5937
Daily SMA1000.6032
Daily SMA2000.6282
 
Levels
Previous Daily High0.6389
Previous Daily Low0.6326
Previous Weekly High0.6477
Previous Weekly Low0.6155
Previous Monthly High0.6314
Previous Monthly Low0.5741
Daily Fibonacci 38.2%0.6365
Daily Fibonacci 61.8%0.635
Daily Pivot Point S10.6342
Daily Pivot Point S20.6303
Daily Pivot Point S30.6279
Daily Pivot Point R10.6404
Daily Pivot Point R20.6428
Daily Pivot Point R30.6467

Author

Anil Panchal

Anil Panchal

FXStreet

Anil Panchal has nearly 15 years of experience in tracking financial markets. With a keen interest in macroeconomics, Anil aptly tracks global news/updates and stays well-informed about the global financial moves and their implications.

More from Anil Panchal
Share:

Editor's Picks

EUR/USD retreats toward 1.1600 after upbeat US data

EUR/USD pulls away from session highs and declines toward 1.1600 in the American session on Wednesday. Upbeat private sector employment and ISM Services PMI data from the US help the US Dollar (USD) stay resilient against its rivals, limiting the pair's upside.

GBP/USD meets resistance around 1.3400

In line with its risk-linked peers, GBP/USD stages a modest comeback on Wednesday, although meeting some resistance around the 1.3400 neighbourhood. Cable’s humble recovery struggles to gather momentum as the Greenback benefits from better-than-forecast macroeconomic data releases.

Gold loses traction after testing $5,200

Gold corrects lower after testing $5,200 but manages to stay in positive territory in the second hald of the day on Wednesday. The precious metal remains well supported by the deterioration of the geopolitical scenario in the Middle East, while the US Dollar's resilience caps the upside.

Crypto Today: Bitcoin, Ethereum, XRP rebound amid mixed ETF flows

The cryptocurrency market is showing subtle recovery signs despite heightened global uncertainty following the United States (US) and Israel attacks on Iran and the subsequent retaliations that have morphed into a wider Middle East war.

First Venezuela, now Iran: The US-China energy war escalates

At first glance, the latest escalation involving the United States with both Iran and Venezuela looks like another chapter in a long-running geopolitical story. But viewed through a broader strategic lens, something else may be unfolding: Energy.

Bittensor extends recovery despite retail demand slump

Bittensor, a leading Artificial Intelligence token, is aging up above $190 at the time of writing on Wednesday. Steady price increases characterise the broader crypto market, with Bitcoin holding above $71,000 and Ethereum above $2,000.