|

NZD/USD mired in congestion near 0.6200

  • NZD/USD set to finish 2023 near a popular congestion level.
  • New Zealand Trade Balance figures softened early Tuesday, limiting Kiwi bulls.
  • This week’s key focus will be US PCE inflation heading into the market holiday.

The NZD/USD sees thin trading in early Tuesday market action, constrained in the 0.6200 neighborhood after slipping from 0.6250.

Further declines aren’t immediately on the card for the Kiwi (NZD) rounding out the early trading week, but disappointing trade figures from New Zealand are doing little to encourage would-be Kiwi bidders.

New Zealand Trade Balance declines $1.234B versus $-1.2B forecast as goods trade slumps

New Zealand’s Trade Balance saw declines through 2023, with both imports and exports falling. Kiwi buyers will have a hard time finding a reason to bid heading through the week, but the majority of market participants will be watching the US Dollar (USD) anyway with one last blast of US inflation data due at the week’s end.

US Personal Consumption Expenditure (PCE) inflation figures, the Federal Reserve’s favored method of tracking inflation, will drop on Friday. US PCE Price Index numbers are expected to hold steady at 0.2% for November, while the PCE Price Index for the year ended November is forecast tick down slightly from 3.5% to 3.3%.

Little else of note exists on the New Zealand data docket this week, although Wednesday’s early Asia market session will see the latest ANZ Roy Morgan Consumer Confidence update for December, which last printed at 91.9 in November.

NZD/USD Technical Outlook

The Kiwi waffled on Monday, pinned to 0.6200 after slipping back from the day’s early peak near 0.6250. Intraday price action has seen the 200-hour Simple Moving Average (SMA) flip from resistance to support near 0.6165, but topside momentum remains limited in the near-term.

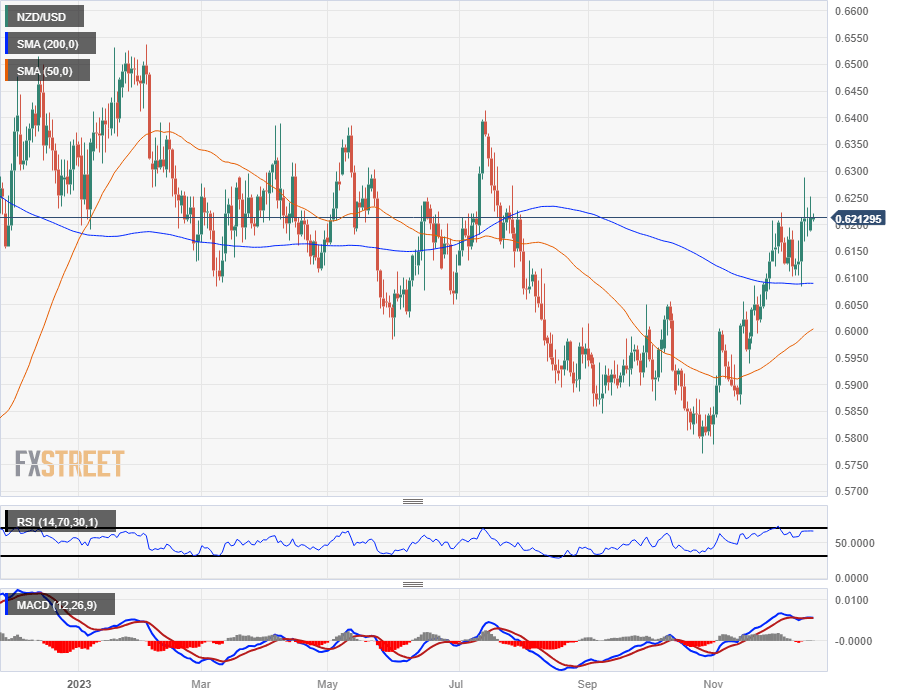
The NZD/USD is trading on the top side of the 200-day SMA just south of the 0.6100 handle, and the pair has climbed over 7.5% from late October’s bottom bids of 0.5772. Despite the climb, the pair remains mired in familiar congestion for most of 2023, and chart paper north of the 200-day SMA has proven frictional, with little in the way of real gains.

NZD/USD Hourly Chart

NZD/USD Daily Chart

NZD/USD Technical Levels

NZD/USD

Overview
Today last price0.6213
Today Daily Change0.0001
Today Daily Change %0.02
Today daily open0.6212
 
Trends
Daily SMA200.613
Daily SMA500.5997
Daily SMA1000.598
Daily SMA2000.6089
 
Levels
Previous Daily High0.6233
Previous Daily Low0.6178
Previous Weekly High0.6287
Previous Weekly Low0.6084
Previous Monthly High0.6208
Previous Monthly Low0.5788
Daily Fibonacci 38.2%0.6212
Daily Fibonacci 61.8%0.6199
Daily Pivot Point S10.6182
Daily Pivot Point S20.6153
Daily Pivot Point S30.6128
Daily Pivot Point R10.6237
Daily Pivot Point R20.6262
Daily Pivot Point R30.6292

Author

Joshua Gibson

Joshua joins the FXStreet team as an Economics and Finance double major from Vancouver Island University with twelve years' experience as an independent trader focusing on technical analysis.

More from Joshua Gibson
Share:

Markets move fast. We move first.

Orange Juice Newsletter brings you expert driven insights - not headlines. Every day on your inbox.

By subscribing you agree to our Terms and conditions.

Editor's Picks

EUR/USD ticks lower following the release of FOMC Minutes

The US Dollar found some near-term demand following the release of the FOMC meeting minutes, with the EUR/USD pair currently piercing the 1.1750 threshold. The document showed officials are still willing to trim interest rates. Meanwhile, thinned holiday trading keeps major pairs confined to familiar levels.

GBP/USD remains sub- 1.3500, remains in the red

The GBP/USD lost traction early in the American session, maintaining the sour tone and trading around 1.3460 following the release of the FOMC meeting minutes. Trading conditions remain thin ahead of the New Year holiday, limiting the pair's volatility.

Gold stable above $4,350 as the year comes to an end

Gold price got to recover some modest ground on Tuesday, holding on to intraday gains and changing hands at $4,360 a troy ounce in the American afternoon. The bright metal showed no reaction to the release of the FOMC December meeting minutes.

Ethereum: ETH holds above $2,900 despite rising selling activity

Ethereum (ETH) held the $2,900 level despite seeing increased selling pressure over the past week. The Exchange Netflow metric showed deposits outweighed withdrawals by about 400K ETH. The high value suggests rising selling activity amid the holiday season.

Economic outlook 2026-2027 in advanced countries: Solidity test

After a year marked by global economic resilience and ending on a note of optimism, 2026 looks promising and could be a year of solid economic performance. In our baseline scenario, we expect most of the supportive factors at work in 2025 to continue to play a role in 2026.

Crypto market outlook for 2026

Year 2025 was volatile, as crypto often is.  Among positive catalysts were favourable regulatory changes in the U.S., rise of Digital Asset Treasuries (DAT), adoption of AI and tokenization of Real-World-Assets (RWA).