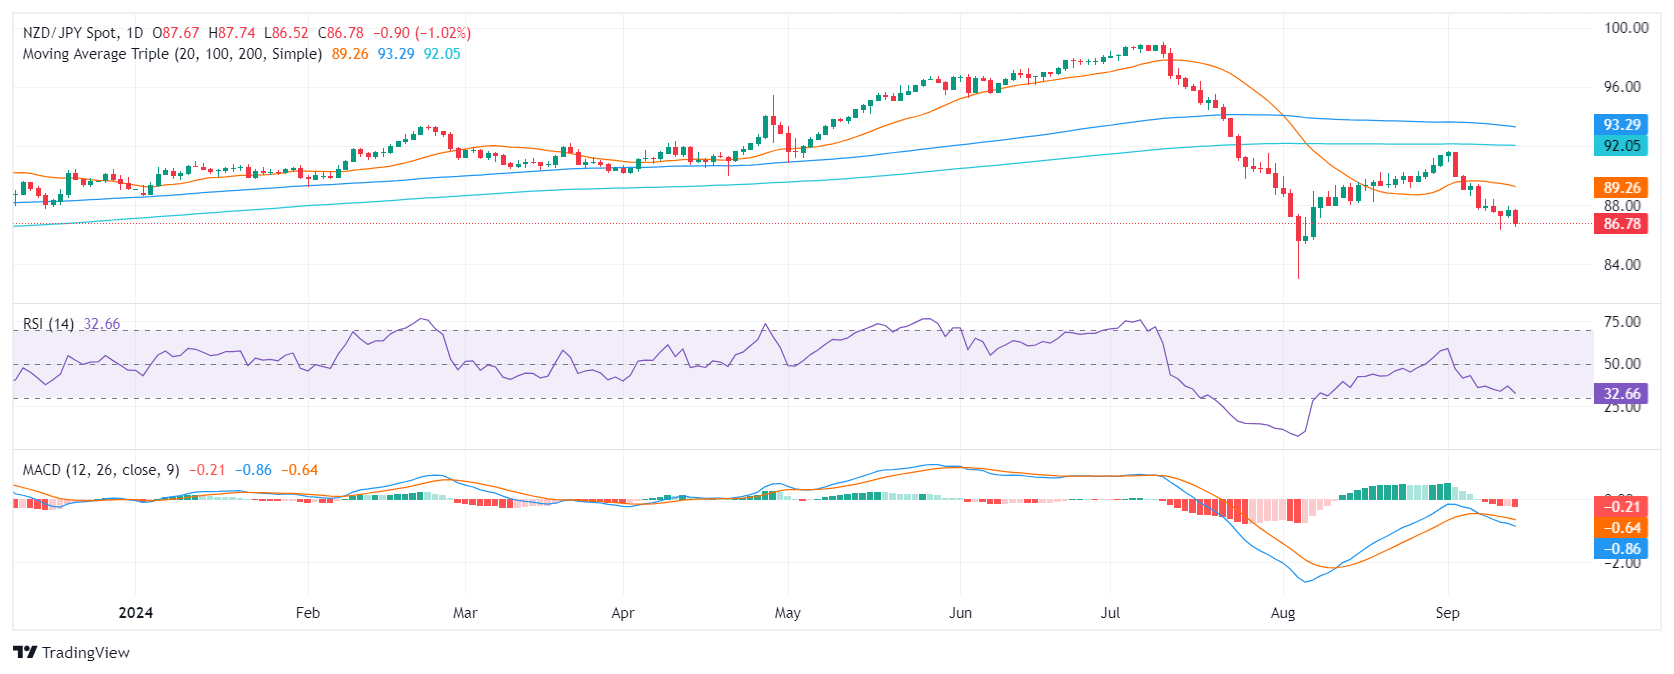
- The NZD/JPY pair has been in a downtrend, declining in four of the last six sessions.
- The RSI is oversold and has a declining slope, indicating that selling pressure is increasing.
- The MACD is also negative and the histogram is rising.
Friday's session saw the NZD/JPY pair decline by more than 1% to 86.60 marking another day of losses. The pair has been in a downtrend over the past week, closing lower in four of the last six sessions. The overall technical outlook for the NZD/JPY is negative, and the pair is likely to continue to decline in the near term.
The RSI is currently near 30, approaching the oversold area. The slope of the RSI is also declining, which suggests that selling pressure is increasing. The MACD is also negative and the histogram is rising, indicating that selling pressure is increasing. However, the oversold signals may indicate that the pair may be poised for an upward correction to consolidate the latest downward movements.
NZD/JPY daily chart
Supports to the downside are located at 86.00, 85.00, and 84.00, while resistances are seen at 88.00, 89.00, and 90.00.
Information on these pages contains forward-looking statements that involve risks and uncertainties. Markets and instruments profiled on this page are for informational purposes only and should not in any way come across as a recommendation to buy or sell in these assets. You should do your own thorough research before making any investment decisions. FXStreet does not in any way guarantee that this information is free from mistakes, errors, or material misstatements. It also does not guarantee that this information is of a timely nature. Investing in Open Markets involves a great deal of risk, including the loss of all or a portion of your investment, as well as emotional distress. All risks, losses and costs associated with investing, including total loss of principal, are your responsibility. The views and opinions expressed in this article are those of the authors and do not necessarily reflect the official policy or position of FXStreet nor its advertisers. The author will not be held responsible for information that is found at the end of links posted on this page.
If not otherwise explicitly mentioned in the body of the article, at the time of writing, the author has no position in any stock mentioned in this article and no business relationship with any company mentioned. The author has not received compensation for writing this article, other than from FXStreet.
FXStreet and the author do not provide personalized recommendations. The author makes no representations as to the accuracy, completeness, or suitability of this information. FXStreet and the author will not be liable for any errors, omissions or any losses, injuries or damages arising from this information and its display or use. Errors and omissions excepted.
The author and FXStreet are not registered investment advisors and nothing in this article is intended to be investment advice.
Recommended content
Editors’ Picks

EUR/USD stays defensive near 1.1350 as US Dollar looks to stabilize
EUR/USD remains on the back foot for the second consecutive session, trading near 1.1350 in the European trading hours on Tuesday. The pair weakens as the US Dollar attempts to regain stability amid the US-China trade war and growing concerns over US recession. German/ EU data are awaited.

GBP/USD battles 1.3200 after UK jobs data
GBP/USD is defending minor bids near the 1.3200 mark in the early European session on Tuesday. The latest data from the UK showed that Unemployment Rate steadied at 4% in the quarter to February while Average Earnings disappointed, weighing negatively on the Pound Sterling.

Gold price retains its positive bias above $3,200 amid US-China trade war, bearish USD
Gold price regains positive traction as US tariff uncertainty continues to underpin safe-haven assets. Bets for aggressive Fed rate cuts in 2025 keep the USD depressed and also benefit the XAU/USD pair.

XRP resilient amid looming ETF deadlines
Ripple (XRP) flaunted a bullish outlook, trading at $2.1505 at the time of writing on Tuesday. Investor risk appetite has continued to grow since the middle of last week, propping XRP for a sustainable upward move, eyeing $3.0000 psychological level.

Is a recession looming?
Wall Street skyrockets after Trump announces tariff delay. But gains remain limited as Trade War with China continues. Recession odds have eased, but investors remain fearful. The worst may not be over, deeper market wounds still possible.

The Best brokers to trade EUR/USD
SPONSORED Discover the top brokers for trading EUR/USD in 2025. Our list features brokers with competitive spreads, fast execution, and powerful platforms. Whether you're a beginner or an expert, find the right partner to navigate the dynamic Forex market.


