|

NZD/JPY Price Analysis: Persistent downtrend breaches more key support levels

  • The NZD/JPY continues its downward plunge, breaking several significant support levels in the recent sessions.
  • The last hope for the pair is that the RSI remains deep in oversold terrain.

In the past trading sessions, the NZD/JPY pair has been moving on a downhill trajectory, now around the 89.00 mark. The pair has consistently posted losses, further highlighting the ongoing bearish impetus. Over the past few weeks, the cross has undergone a fall of over 7%, situating itself further below the crucial 200-day Simple Moving Average (SMA).

While the pair carries on with its steady decline, daily technical indicators hint at oversold conditions. These conditions indicate a potential for an upcoming period of stable trading, despite the continuing descent. The Relative Strength Index (RSI) has been dwelling in the oversold area which might prompt an upward correction to counter the selling pressure. Simultaneously, the Moving Average Convergence Divergence (MACD) continues to present flat red bars, suggesting a pause in the selling onslaught.

NZD/JPY daily chart

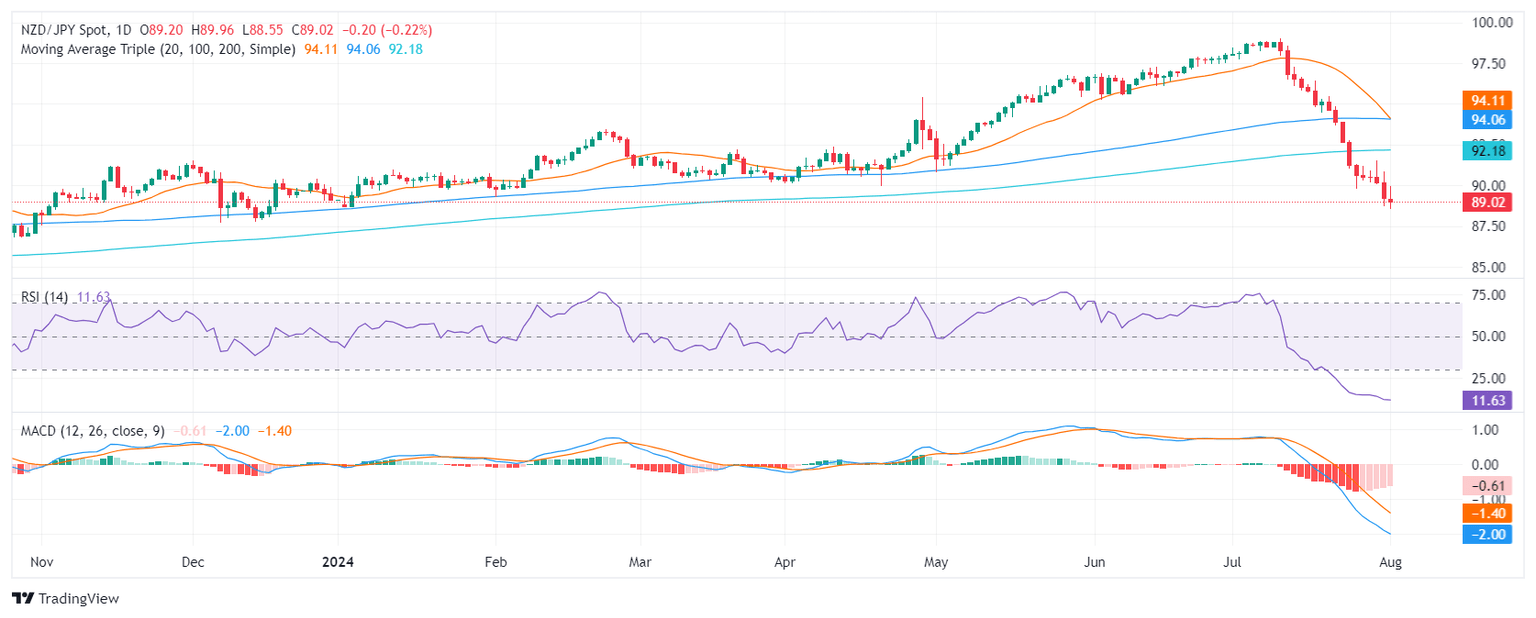
Situated south of 90.00, the pair grapples with the task of maintaining levels set at 88.50, 88.30 and 88.00. Conversely, resistance levels are eyed at 90.000, and 92.00 around the 200-day SMA.

Author

Patricio Martín

Patricio is an economist from Argentina passionate about global finance and understanding the daily movements of the markets.

More from Patricio Martín
Share:

Editor's Picks

EUR/USD accelerates losses, focus is on 1.1800

EUR/USD’s selling pressure is gathering pace now, opening the door to a potential test of the key 1.1800 region sooner rather than later. The pair’s pullback comes on the back of marked gains in the US Dollar following US data releases and the publication of the FOMC Minutes later in the day.

GBP/USD turns negative near 1.3540

GBP/USD reverses its initial upside momentum and is now adding to previous declines, revisiting at the same time the 1.3540 region on Wednesday. Cable’s downtick comes on the back of decent gains in the Greenback and easing UK inflation figures, which seem to have reinforced the case for a BoE rate cut in March.

Gold picks pace, flirts with $5,000

Gold is back on the front foot on Wednesday, shaking off part of the early week softness and pushing higher towards the key $5,000 mark per troy ounce. The move comes ahead of the FOMC Minutes and is unfolding despite an intense rebound in the US Dollar.

Fed Minutes to shed light on January hold decision amid hawkish rate outlook

The Minutes of the Fed’s January 27-28 monetary policy meeting will be published today. Details of discussions on the decision to leave the policy rate unchanged will be scrutinized by investors.

Mixed UK inflation data no gamechanger for the Bank of England

Food inflation plunged in January, but service sector price pressure is proving stickier. We continue to expect Bank of England rate cuts in March and June. The latest UK inflation read is a mixed bag for the Bank of England, but we doubt it drastically changes the odds of a March rate cut.

Sui extends sideways action ahead of Grayscale’s GSUI ETF launch

Sui is extending its downtrend for the second consecutive day, trading at 0.95 at the time of writing on Wednesday. The Layer-1 token is down over 16% in February and approximately 34% from the start of the year, aligning with the overall bearish sentiment across the crypto market.