|

NZD/JPY Price Analysis: Pair tests 100-day SMA amid steady momentum

  • NZD/JPY inches up to 88.90 on Tuesday, maintaining its recent positive streak.
  • RSI climbs to 55, signaling improving sentiment, while MACD prints flat green bars.
  • The 100-day SMA stands as a key hurdle, challenging further upside progress.

NZD/JPY extended its mild gains on Tuesday, nudging higher to 88.90 and building on the tentative recovery seen earlier in the week. Despite this constructive move, the pair appears to be stalling around the 100-day Simple Moving Average (SMA), underscoring a critical barrier that may temper the overall bullish momentum.

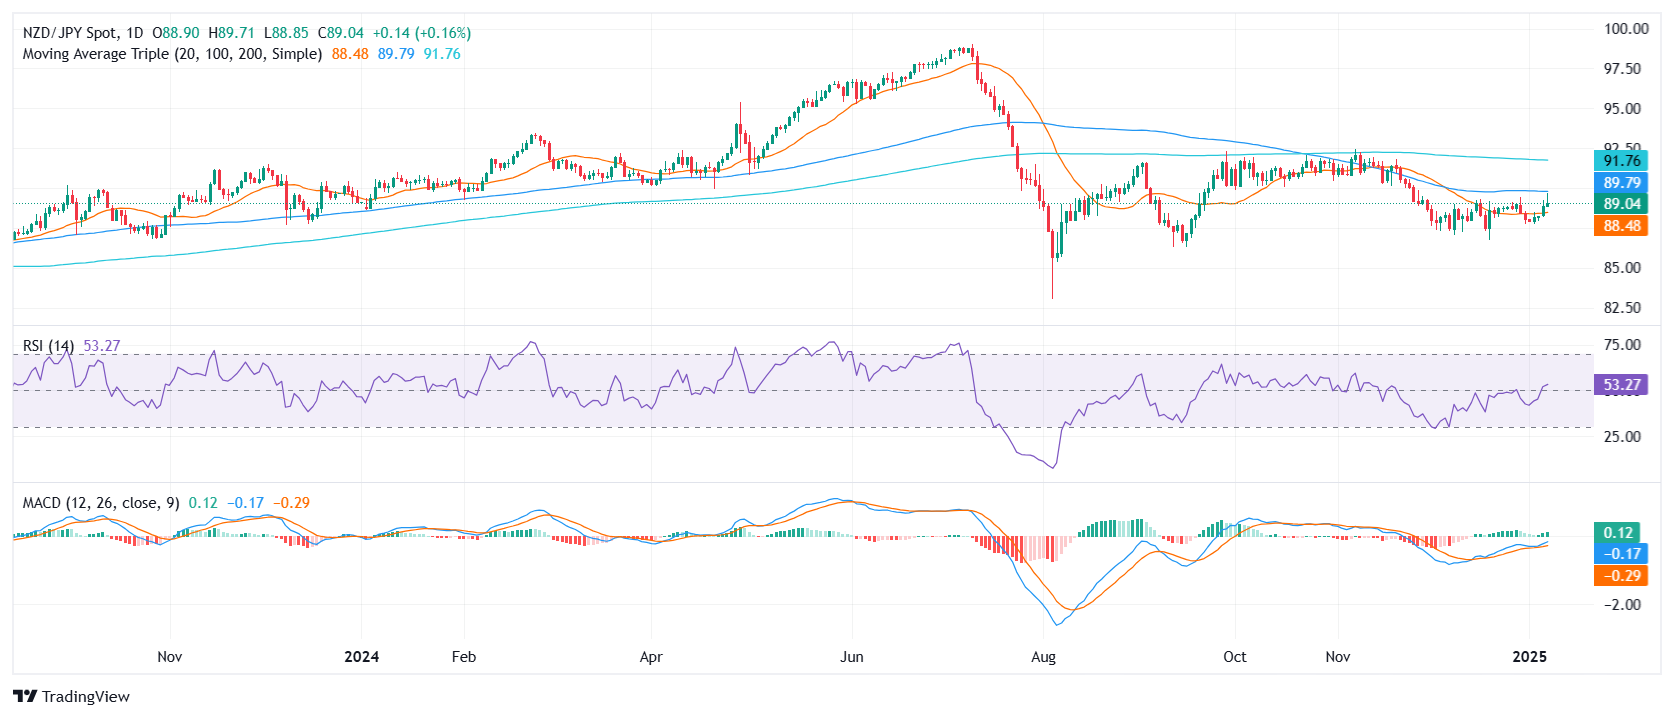
From a technical standpoint, the Relative Strength Index (RSI) has risen to 55, placing it in positive territory and suggesting moderate buying interest. Meanwhile, the Moving Average Convergence Divergence (MACD) histogram remains flat and green, indicating that bullish momentum is present but not overwhelming. Until NZD/JPY clears the 100-day SMA with conviction, traders may remain cautious about chasing further upside.

NZD/JPY daily chart

Author

Patricio Martín

Patricio is an economist from Argentina passionate about global finance and understanding the daily movements of the markets.

More from Patricio Martín
Share:

Markets move fast. We move first.

Orange Juice Newsletter brings you expert driven insights - not headlines. Every day on your inbox.

By subscribing you agree to our Terms and conditions.

Editor's Picks

EUR/USD trades with negative bias around 1.1730 amid recovering USD; downside seems limited

The EUR/USD pair kicks off the new week on a softer note, though it remains within striking distance of the highest level since early October, touched last Thursday. Spot prices currently trade around the 1.1730 region, down less than 0.10% for the day.

GBP/USD holds steady above mid-1.3300s as traders await key data and BoE this week

The GBP/USD pair remains on the defensive during the Asian session on Monday, though it lacks bearish conviction and holds above the 200-day Simple Moving Average pivotal support. Spot prices currently trade around the 1.3360 region, nearly unchanged for the day.

Gold regains traction toward $4,350 in the final full week of 2025

Gold price picks up bids once again toward $4,350 in Asian trading on Monday. The precious metal extends its upside to the highest since October 21 amid the prospect of interest rate cuts by the US Federal Reserve next year. The delayed US Nonfarm Payrolls report for October will be in the spotlight later on Tuesday. 

Top Crypto Losers: DASH, SPX, PENGU – Privacy and meme coins lose ground

Altcoins, including Dash, SPX6900, and Pudgy Penguins, are leading losses as the broader cryptocurrency market remains cautious ahead of the macroeconomic data releases, such as the US Nonfarm payroll report, CPI data, and the Bank of Japan’s rate-hike decision.

Big week ends with big doubts

The S&P 500 continued to push higher yesterday as the US 2-year yield wavered around the 3.50% mark following a Federal Reserve (Fed) rate cut earlier this week that was ultimately perceived as not that hawkish after all. The cut is especially boosting the non-tech pockets of the market.

Aave Price Forecast: AAVE primed for breakout as bullish signals strengthen

Aave (AAVE) price is trading above $204 at the time of writing on Friday and approaching the upper boundary of its descending parallel channel; a breakout from this structure would favor the bulls.