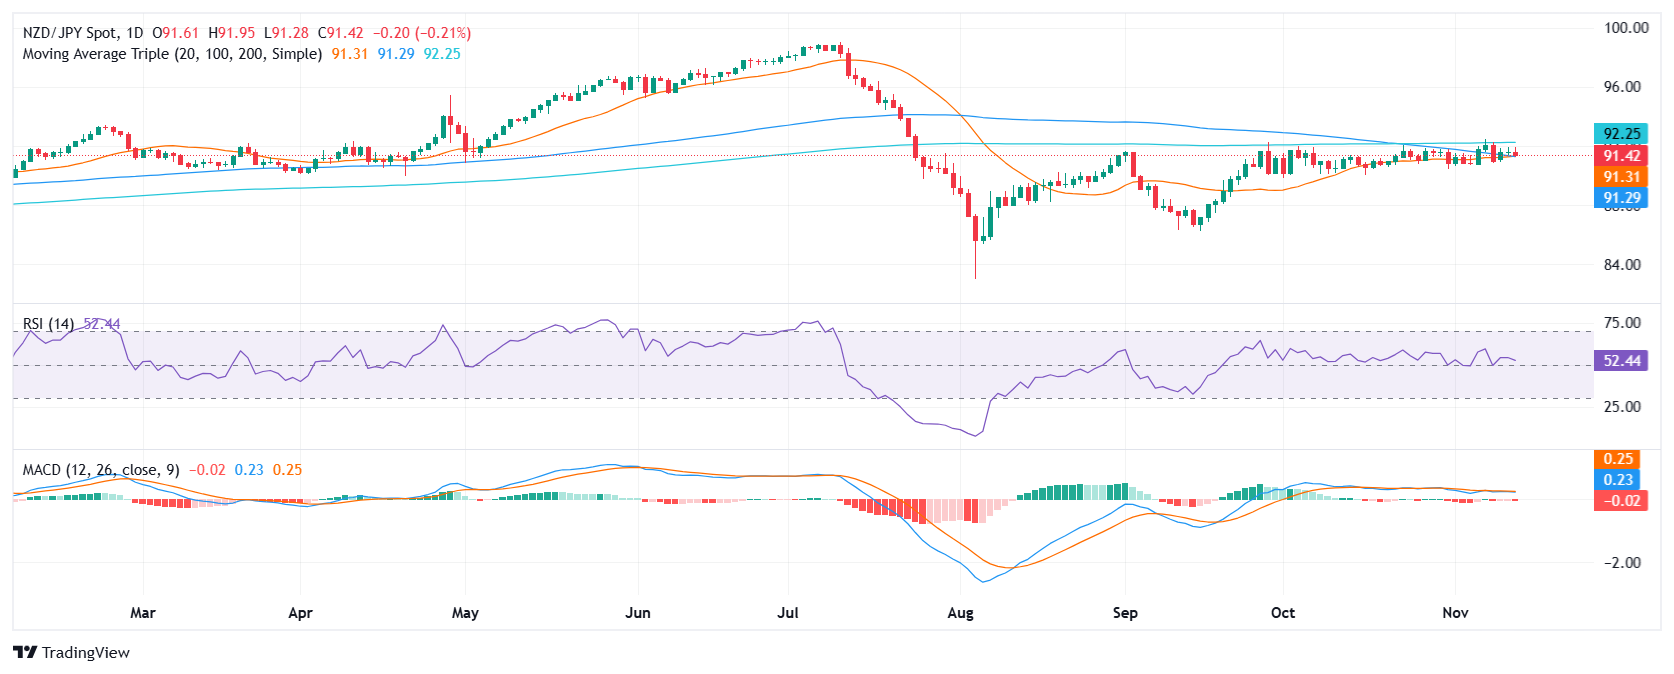
- NZD/JPY declines on Wednesday, trading near 91.45.
- The pair completed a bearish crossover between the 20 and 100-day SMA.
- The RSI and MACD technical indicators suggest the NZD/JPY pair outlook remains mixed.
The NZD/JPY pair witnessed a slight pullback during Wednesday's session, dipping below the 91.50 level. This retracement follows a period of gains on Tuesday, but the pair remains confined within a clear trading channel between 92.00 and 91.00. Additionally A bearish crossover, recently completed between the 20 and 100-day Simple Moving Average (SMA) might push the pair lower.
Technically, the Relative Strength Index (RSI) suggests that buying pressure is declining, as it stands at 53, in positive terrain, but declining. Additionally, the Moving Average Convergence Divergence (MACD) histogram is flat and red, suggesting that selling pressure is present. Therefore, the overall outlook for the pair remains mixed, and it is worth monitoring the price action around the 91.00 and 92.00 boundaries.
Support levels are located at 91.00, 90.50, and 90.00, while resistance levels are at 92.00, 92.50, and 93.00.
NZD/JPY daily chart
Information on these pages contains forward-looking statements that involve risks and uncertainties. Markets and instruments profiled on this page are for informational purposes only and should not in any way come across as a recommendation to buy or sell in these assets. You should do your own thorough research before making any investment decisions. FXStreet does not in any way guarantee that this information is free from mistakes, errors, or material misstatements. It also does not guarantee that this information is of a timely nature. Investing in Open Markets involves a great deal of risk, including the loss of all or a portion of your investment, as well as emotional distress. All risks, losses and costs associated with investing, including total loss of principal, are your responsibility. The views and opinions expressed in this article are those of the authors and do not necessarily reflect the official policy or position of FXStreet nor its advertisers. The author will not be held responsible for information that is found at the end of links posted on this page.
If not otherwise explicitly mentioned in the body of the article, at the time of writing, the author has no position in any stock mentioned in this article and no business relationship with any company mentioned. The author has not received compensation for writing this article, other than from FXStreet.
FXStreet and the author do not provide personalized recommendations. The author makes no representations as to the accuracy, completeness, or suitability of this information. FXStreet and the author will not be liable for any errors, omissions or any losses, injuries or damages arising from this information and its display or use. Errors and omissions excepted.
The author and FXStreet are not registered investment advisors and nothing in this article is intended to be investment advice.
Recommended content
Editors’ Picks

EUR/USD holds gains above 1.0800 after EU inflation data
EUR/USD is holding gains above 1.0800 in the European session on Tuesday after the mixed Eurozone inflation data. The pair is driven by renewed US Dollar weakness as attention turns toward the US jobs survey and ISM PMI data amid looming Trump's reciprocal tariffs.

GBP/USD treads water above 1.2900 ahead of US data, tariffs
GBP/USD is trading on the defensive while holding above 1.2900 in Tuesday's European trading. The pair loses ground amid a modest US Dollar uptick as traders resort to repositioning in the lead-up to the top-tier US economic data releases and Wednesday's tariffs announcements.

Gold price eases from record high; bullish bias remains amid worries over Trump's tariffs
Gold price retreats slightly after touching a fresh all-time high on Tuesday as bulls pause for a breather and opt to wait for US President Donald Trump's reciprocal tariffs announcement. Adding to this, a positive tone around the Asian equity markets also acts as a headwind for the commodity amid overbought conditions on the daily chart.

PEPE could rally to double digits if it breaks above its key resistance level
Pepe memecoin approaches its descending trendline, trading around $0.000007 on Tuesday; a breakout indicates a bullish move ahead. Moreover, PEPE's long-to-short ratio supports a bullish thesis as bullish bets among the traders reach the highest over a month.

Is the US economy headed for a recession?
Leading economists say a recession is more likely than originally expected. With new tariffs set to be launched on April 2, investors and economists are growing more concerned about an economic slowdown or recession.

The Best brokers to trade EUR/USD
SPONSORED Discover the top brokers for trading EUR/USD in 2025. Our list features brokers with competitive spreads, fast execution, and powerful platforms. Whether you're a beginner or an expert, find the right partner to navigate the dynamic Forex market.