|

NZD/JPY Price Analysis: Fresh decline heightens downside risk

  • NZD/JPY landed near 87.80 after the latest rejection at 89.00.
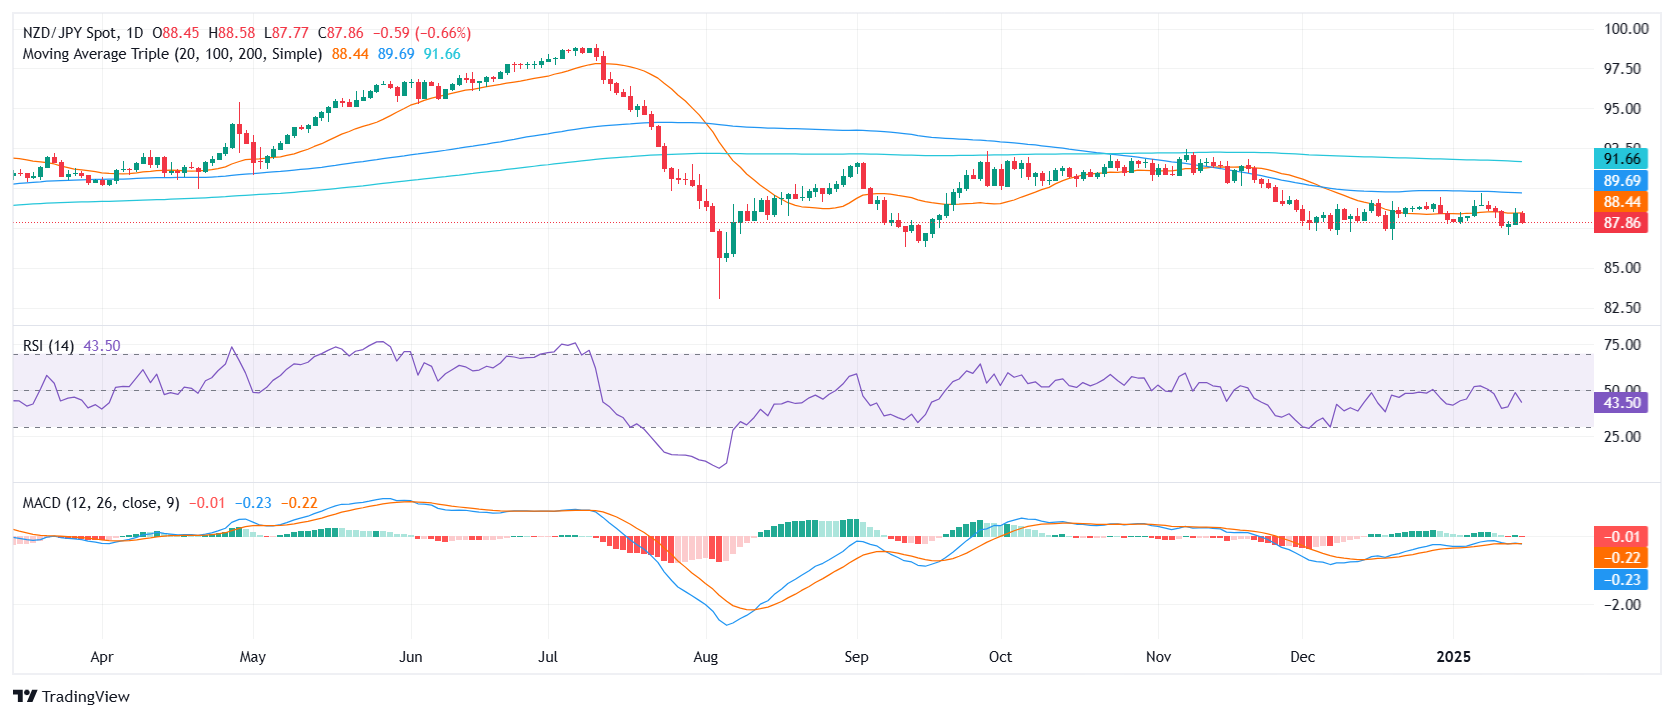
  • RSI slides to 44 in negative territory, hinting that selling forces may be gaining ground.
  • MACD histogram prints flat red bars, underscoring the pair’s fragile recovery attempts.

The NZD/JPY cross entered deeper negative territory on Wednesday, giving back 0.77% as it settled around 87.80. Sellers took charge following yet another failed effort to conquer the 20-day Simple Moving Average (SMA) near the 89.00 mark. Although the pair had initially shown signs of stabilization within the broader 89.00–87.00 channel, persistent selling pressure has kept it from mounting a convincing rebound.

On the technical front, the Relative Strength Index (RSI) has weakened to 44, reflecting a loss of buying momentum. Similarly, the Moving Average Convergence Divergence (MACD) histogram remains flat and in the red, indicating that the pair’s attempts at recovery lack robust follow-through. This combination of weakening indicators and repeated rejections at 89.00 casts doubt on any near-term upside potential.

As for immediate levels to watch, a drop under 87.50 would place the 87.00 floor under scrutiny, potentially dragging NZD/JPY into deeper territory if selling picks up. In contrast, a clean break above 89.00 remains critical to shifting the short-term bias back toward bullish territory, though buyers seem reluctant to push the market decisively higher at this juncture.

NZD/JPY daily chart

Author

Patricio Martín

Patricio is an economist from Argentina passionate about global finance and understanding the daily movements of the markets.

More from Patricio Martín
Share:

Markets move fast. We move first.

Orange Juice Newsletter brings you expert driven insights - not headlines. Every day on your inbox.

By subscribing you agree to our Terms and conditions.

Editor's Picks

EUR/USD stays defensive below 1.1750 as USD finds its feet

EUR/USD kicks off the new week on a softer note, holding below 1.1750 in European trading on Monday. The pair faces challenges due to a pause in the US Dollar downtrend, with traders shifting their focus to the delayed US Nonfarm Payrolls and CPI data for fresh directives. The ECB policy decision is also eagerly awaited. 

GBP/USD holds steady above 1.3350 as traders await key data and BoE

GBP/USD remains on the back foot above 1.3350 in the European session on Monday, though it lacks bearish conviction and holds above the key 200-day SMA support. The US Dollar holds its recovery mode ahead of key data releases, while the Pound Sterling faces headwinds from the expected BoE rate cut this week. 

Gold climbs to seven-week highs on Fed rate cut bets, safe-haven demand

Gold price rises to seven-week highs to near $4,350 during the early European trading hours on Monday. The precious metal extends its upside amid the prospect of interest rate cuts by the US Fed next year. Lower interest rates could reduce the opportunity cost of holding Gold, supporting the non-yielding precious metal.

Solana consolidates as spot ETF inflows near $1 billion signal institutional dip-buying

Solana price hovers above $131 at the time of writing on Monday, nearing the upper boundary of a falling wedge pattern, awaiting a decisive breakout. On the institutional side, demand for spot Solana Exchange-Traded Funds remained firm, pushing total assets under management to nearly $1 billion since launch. 

Big week ends with big doubts

The S&P 500 continued to push higher yesterday as the US 2-year yield wavered around the 3.50% mark following a Federal Reserve (Fed) rate cut earlier this week that was ultimately perceived as not that hawkish after all. The cut is especially boosting the non-tech pockets of the market.

Solana Price Forecast: SOL consolidates as spot ETF inflows near $1 billion signal institutional dip-buying

Solana (SOL) price hovers above $131 at the time of writing on Monday, nearing the upper boundary of a falling wedge pattern, awaiting a decisive breakout.