NZD/JPY Price Analysis: Failure around 76.70s put sellers in control as the pair heads towards 76.00


  • The commodity-linked New Zealand dollar ended Friday’s session with losses of 0.69%.
  • The NZD/JPY retracement from weekly tops could lead to further losses below 76.00.

The NZD/JPY slumps for the second time in the week as traders get headed into the weekend. As Wall Street closed and thin liquidity conditions hit the FX market, the NZD/JPY is trading at 76.17 at the time of writing.

On Friday, Wall Street closed with gains, led by the Nasdaq, and the S&P 500, up 1.37% and 0.52%. Meanwhile, the Dow Jones Industrial finished flat in the day. 

In the FX market, the low-yielder EUR was the gainer of the session, while the commodity currencies led by the AUD, CAD, and NZD were the principal losers, down 0.80%, 0.70%, and 0.69%, each.

NZD/JPY Price Forecast: Technical outlook

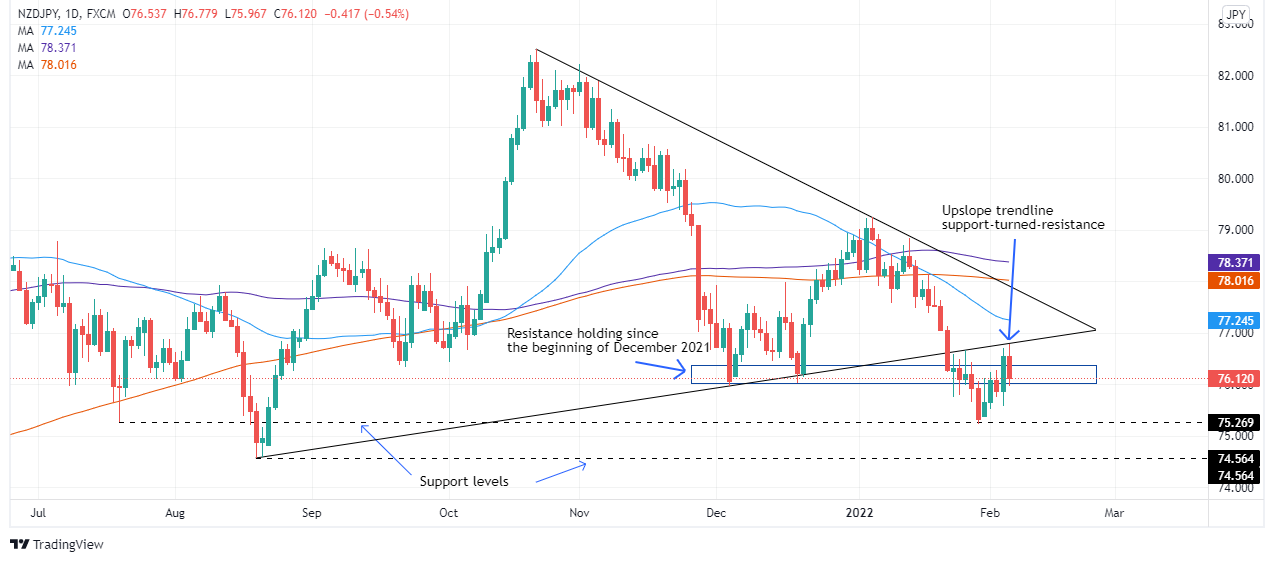
Putting Friday’s recap on the side, the NZD/JPY, as abovementioned, finished the week with losses but clung to the 76.00 figure. It is worth noting that the daily moving averages (DMAs) reside above the spot price, suggesting the pair might be headed downwards. Additionally, the failure of an upbreak of an upslope trendline drawn from August 2021 lows previous support-turned-resistance exacerbated the retracement from weekly tops near 76.80s towards the 76.10 area.

That said, the NZD/JPY first support would be 76.00. Breach of the latter would send the pair tumbling to February 3 low at 75.57, followed by January 26 cycle and YTD low at 75.21, a zone that could witness some buying pressure, before reaching 2021 yearly low at 74.55.

NZD/JPY

Overview
Today last price 76.14
Today Daily Change -0.38
Today Daily Change % -0.50
Today daily open 76.52
 
Trends
Daily SMA20 76.99
Daily SMA50 77.31
Daily SMA100 78.43
Daily SMA200 78.07
 
Levels
Previous Daily High 76.7
Previous Daily Low 75.59
Previous Weekly High 76.67
Previous Weekly Low 75.24
Previous Monthly High 79.24
Previous Monthly Low 75.24
Daily Fibonacci 38.2% 76.27
Daily Fibonacci 61.8% 76.01
Daily Pivot Point S1 75.84
Daily Pivot Point S2 75.16
Daily Pivot Point S3 74.73
Daily Pivot Point R1 76.95
Daily Pivot Point R2 77.38
Daily Pivot Point R3 78.06


Share: Feed news

Information on these pages contains forward-looking statements that involve risks and uncertainties. Markets and instruments profiled on this page are for informational purposes only and should not in any way come across as a recommendation to buy or sell in these assets. You should do your own thorough research before making any investment decisions. FXStreet does not in any way guarantee that this information is free from mistakes, errors, or material misstatements. It also does not guarantee that this information is of a timely nature. Investing in Open Markets involves a great deal of risk, including the loss of all or a portion of your investment, as well as emotional distress. All risks, losses and costs associated with investing, including total loss of principal, are your responsibility. The views and opinions expressed in this article are those of the authors and do not necessarily reflect the official policy or position of FXStreet nor its advertisers. The author will not be held responsible for information that is found at the end of links posted on this page.

If not otherwise explicitly mentioned in the body of the article, at the time of writing, the author has no position in any stock mentioned in this article and no business relationship with any company mentioned. The author has not received compensation for writing this article, other than from FXStreet.

FXStreet and the author do not provide personalized recommendations. The author makes no representations as to the accuracy, completeness, or suitability of this information. FXStreet and the author will not be liable for any errors, omissions or any losses, injuries or damages arising from this information and its display or use. Errors and omissions excepted.

The author and FXStreet are not registered investment advisors and nothing in this article is intended to be investment advice.

Recommended content


Recommended content

Editors’ Picks

GBP/USD hovers around 1.2750 on UK election day

GBP/USD hovers around 1.2750 on UK election day

GBP/USD is trading sideways near 1.2750 in the European session on Thursday. A broadly softer US Dollar keeps the pair afloat but traders refrain from placing fresh bets on the Pound Sterling, as UK voters head to polls. 

GBP/USD News

EUR/USD retakes 1.0800 ahead of ECB Accounts

EUR/USD retakes 1.0800 ahead of ECB Accounts

EUR/USD is battling 1.0800, regaining upside momentum in the European session on Thursday. The pair's renewed uptick is attributed to fresh US Dollar selling on escalated speculations of a September Fed rate cut. ECB Accounts is next in focus. 

EUR/USD News

Gold trades with caution above $2,350, as focus shifts to US NFP

Gold trades with caution above $2,350, as focus shifts to US NFP

Gold price has reversed early gains to trade cautiously above $2,350 on Thursday. Sustained US Dollar weakness alongside sluggish US Treasury bond yields keeps the downside in Gold price capped amid the July 4 US holiday-thinned market conditions. Friday's NFP data eyed. 

Gold News

MANTRA partners with UAE real estate giant MAG to tokenize $500 million in assets

MANTRA partners with UAE real estate giant MAG to tokenize $500 million in assets

MANTRA announced its partnership with UAE real estate giant MAG on Wednesday via social media platform X. This collaboration introduces new investment opportunities for tokenized real estate worth $500 million in the flourishing Middle Eastern market.

Read more

Investors await NFP to validate their Fed rate cut bets

Investors await NFP to validate their Fed rate cut bets

Investors expect two rate cuts, even though Fed signals one. Recent data corroborates investors’ take. Nonfarm Payrolls waited for more confirmation.

Read more

Forex MAJORS

Cryptocurrencies

Signatures