|

NZD/JPY Price Analysis: Buyers lose momentum, eyes on SMA crossover

  • NZD/JPY edges lower under the 91.000 mark as selling pressure mounts.
  • RSI declining, suggesting falling buying momentum.
  • The 20-day SMA continues to be a strong barrier.

In Friday's session, the NZD/JPY pair declined by 0.20% to 90.80, encountering increased resistance and losing ground still holding the key 20-day Simple Moving Average (SMA).

NZD/JPY daily chart

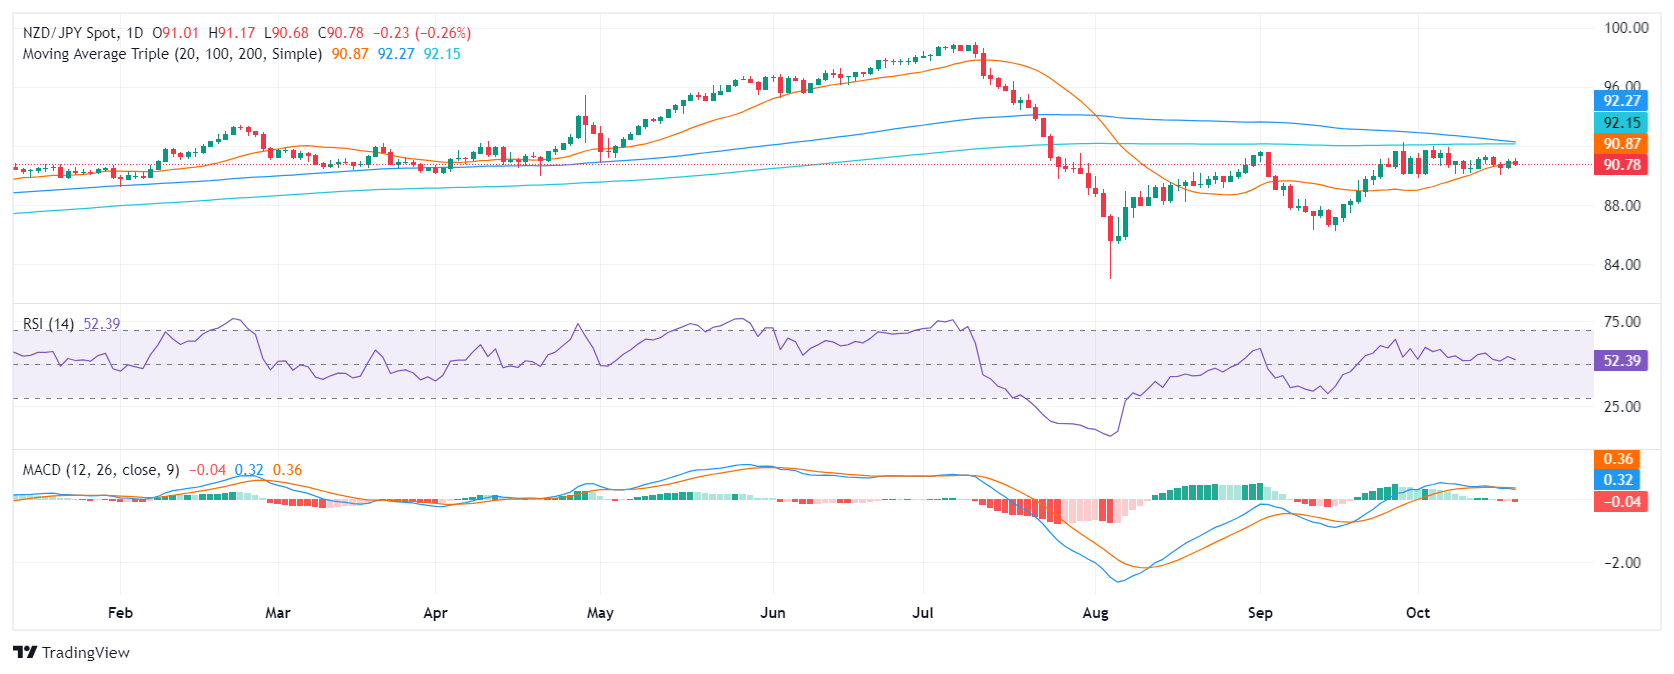
The daily Relative Strength Index (RSI) for NZD/JPY has dropped to 52, indicating a decline in buying pressure. The decreasing RSI values suggest that momentum is shifting in favor of the sellers but while it remains close to the middle point it suggests a neutral momentum. Moreover, the Moving Average Convergence Divergence (MACD) histogram has flattened and moved into negative territory. This technical indicator suggests that selling pressure is increasing and that the downward trend could continue.

The 100, and 200-day SMAs are close to perform a bearish crossover around the 92.00 mark which could be the catalyst the sellers need to enter the next bearish leg.

On the buyer’s side, the 20-day SMA, serves as a critical support level, continues to attract buyers and the sellers are being unable to breach it. However, if the pair breaks below this level, it could signal a further decline in prices. Critical support levels for the NZD/JPY pair are located at 91.00, 90.30 and 90.00, while resistance levels lie at 92.00, 92.15 ,and 92.50.

Author

Patricio Martín

Patricio is an economist from Argentina passionate about global finance and understanding the daily movements of the markets.

More from Patricio Martín
Share:

Markets move fast. We move first.

Orange Juice Newsletter brings you expert driven insights - not headlines. Every day on your inbox.

By subscribing you agree to our Terms and conditions.

Editor's Picks

EUR/USD trades with negative bias around 1.1730 amid recovering USD; downside seems limited

The EUR/USD pair kicks off the new week on a softer note, though it remains within striking distance of the highest level since early October, touched last Thursday. Spot prices currently trade around the 1.1730 region, down less than 0.10% for the day.

GBP/USD holds steady above mid-1.3300s as traders await key data and BoE this week

The GBP/USD pair remains on the defensive during the Asian session on Monday, though it lacks bearish conviction and holds above the 200-day Simple Moving Average pivotal support. Spot prices currently trade around the 1.3360 region, nearly unchanged for the day.

Gold retains bullish bias ahead of this week’s key US macro releases

Gold attracts buyers for the fifth straight day and climbs to the $4,330 region during the Asian session on Monday. The commodity remains well within striking distance of its highest level since October 21, touched on Friday, and seems poised to appreciate further amid a supportive fundamental backdrop. 

Top Crypto Losers: DASH, SPX, PENGU – Privacy and meme coins lose ground

Altcoins, including Dash, SPX6900, and Pudgy Penguins, are leading losses as the broader cryptocurrency market remains cautious ahead of the macroeconomic data releases, such as the US Nonfarm payroll report, CPI data, and the Bank of Japan’s rate-hike decision.

Big week ends with big doubts

The S&P 500 continued to push higher yesterday as the US 2-year yield wavered around the 3.50% mark following a Federal Reserve (Fed) rate cut earlier this week that was ultimately perceived as not that hawkish after all. The cut is especially boosting the non-tech pockets of the market.

Aave Price Forecast: AAVE primed for breakout as bullish signals strengthen

Aave (AAVE) price is trading above $204 at the time of writing on Friday and approaching the upper boundary of its descending parallel channel; a breakout from this structure would favor the bulls.