|

NZD/JPY Price Analysis: Bullish momentum remains, indicators gather strength

  • The NZD/JPY rose by nearly 0.90% to 89.80 on Friday.
  • The RSI is in positive territory and rising, indicating buying pressure.
  • The MACD is showing rising green bars, suggesting increasing bullish momentum.

In Friday's session, the NZD/JPY continued its climb, propelled by a 0.90% rise to 89.80. This upward trajectory indicates that the pair is gaining strength following the recent consolidation above the 89.00 level. The pair is also riding a substantial winning streak and exhibiting signs of technical strength, amplifying the possibility of further advancements.

Examining the Relative Strength Index (RSI), it is currently positioned at 54, suggesting that buying pressure is elevated and remains a driving force behind the pair's momentum. Additionally, the Moving Average Convergence Divergence (MACD) is painting a bullish picture, with rising green bars indicating increasing bullish momentum.

NZD/JPY daily chart

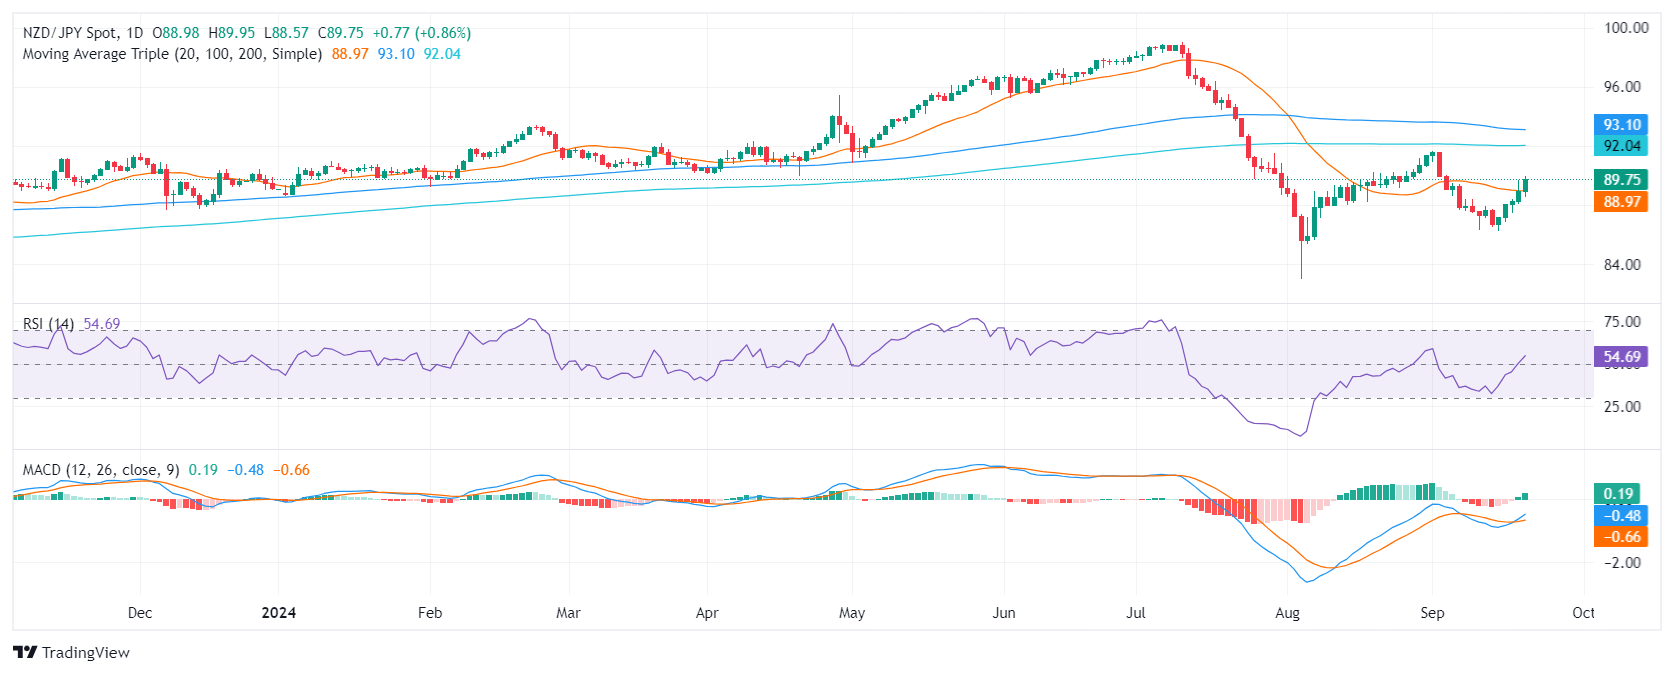
As for notable support and resistance levels, round support levels can be identified at 87.00, 86.50, and 86.00. Meanwhile, resistance levels can be found at 89.50, 90.00, and 90.50. The pair's breach past the 89.00 level has provided further confirmation of its bullish momentum, and sustained trading above this level could pave the way for a continued ascent..

Author

Patricio Martín

Patricio is an economist from Argentina passionate about global finance and understanding the daily movements of the markets.

More from Patricio Martín
Share:

Editor's Picks

EUR/USD risks a deeper drop below 1.1750

EUR/USD keeps its vacillating mood in place as the the NA session drwas to a close on Tuesday, hovering below the 1.1800 hurdle amid acceptable gains in the US Dollar. In the meantime, market participants and the FX galaxy are expected to closely follow President Trump’s SOTU speech around 2AM GMT.
 

GBP/USD regains 1.3500 and above

GBP/USD extends its advance for the third day in a row on Tuesday, this time retesting the area beyond the 1.3500 hurdle. Cable’s uptick comes despite decent gains in the Greenback and the dovish message from the BoE’s Bailey at the UK Parliament.

Gold appears offered around $5,150

Gold is giving back a good portion of the recent multi-day rally, receding to the $5,150 zone per troy ounce amid the decent bounce in the US Dollar and mixed US Treasuty yields. In the meantime, markets’ attention remain on upcoming comments from Fed speakers.

Ripple’s DeFi shift in focus: Navigating XRPL EVM sidechain growth, XRPFi migration and liquidity
Ripple (XRP) has continued to trade under pressure, extending its decline by approximately 63% from the record high of $3.66 in July. The remittance token is trading above support at $1.35, while its upside appears limited by key supply zones, starting with $1.40, at the time of writing on Tuesday.
The Citrini report: How a debatable AI narrative can shake Wall Street

That AI-related headline alone was enough to rattle investors.US stocks slid sharply on Monday after a widely circulated Citrini Research memo outlined a hypothetical “2028 Global Intelligence Crisis”, warning that rapid AI adoption could push US unemployment into double digits as early as by mid-2028.

XRP pressured by weak ETF flows and declining retail interest

Ripple (XRP) is edging lower, trading above its intraday low of $1.32 at the time of writing on Tuesday. The decline from its weekly opening of $1.39 reflects heightened volatility in the broader cryptocurrency market, accentuated by tariff-triggered uncertainty.