|

NZD/JPY Price Analysis: Bullish momentum eases, buyers and sellers find consolidation

  • The daily chart escapes overbought signals as the overall trend begins to consolidate.
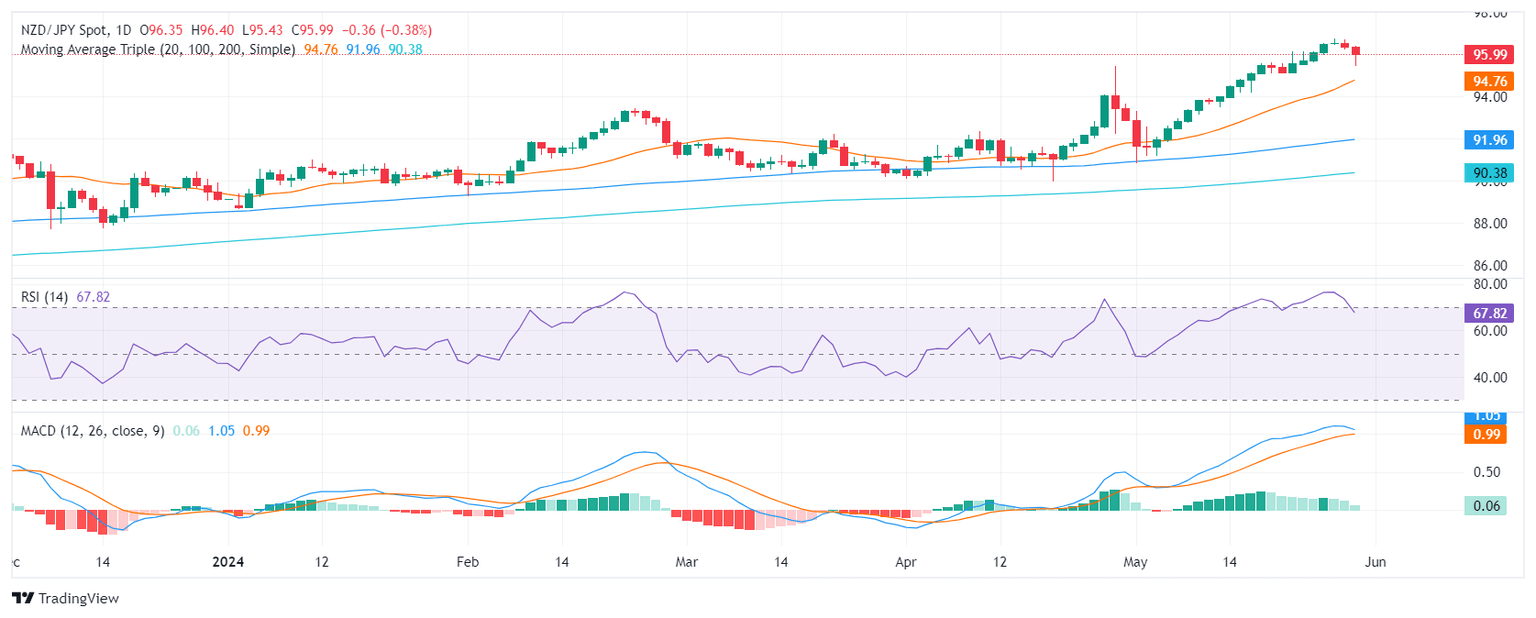
  • After reaching multi-year highs above 96.70, NZD/JPY enters a phase of consolidation with support found at 95.50.
  • The 95.00 offers strong support to prevent further losses.

On Thursday's trading session, the NZD/JPY pair underwent further corrections, with sellers gaining momentum. Nonetheless, the pair managed to clear some losses and found strong support at 95.50. Traders are also eying the 95.00 threshold to prevent further losses. While signs of a possible reversal in momentum have waned, the overall outlook remains a phase of consolidation.

According to the daily chart indicators, the Relative Strength Index (RSI) now stands below 70, reflecting a change from previous overbought conditions. This coincides with a potential pause or slow in price gains. Simultaneously, the Moving Average Convergence Divergence (MACD) indicates a decrease in positive momentum with shrinking green bars.

NZD/JPY daily chart

Glancing at the hourly chart, the RSI and MACD histograms have both flattened in negative territory. This suggests that sellers may be losing traction on an hourly basis, indicating consolidation.

NZD/JPY hourly chart

As the consolidation phase continues, any downward movements that keep the pair above its Simple Moving Averages (SMAs) could be considered corrective, providing the pair stays above the key support level of 95.00.

NZD/JPY

Overview
Today last price95.99
Today Daily Change-0.36
Today Daily Change %-0.37
Today daily open96.35
 
Trends
Daily SMA2094.54
Daily SMA5092.7
Daily SMA10091.9
Daily SMA20090.33
 
Levels
Previous Daily High96.71
Previous Daily Low96.24
Previous Weekly High96.15
Previous Weekly Low95.08
Previous Monthly High95.42
Previous Monthly Low89.96
Daily Fibonacci 38.2%96.42
Daily Fibonacci 61.8%96.53
Daily Pivot Point S196.15
Daily Pivot Point S295.96
Daily Pivot Point S395.68
Daily Pivot Point R196.63
Daily Pivot Point R296.91
Daily Pivot Point R397.1

Author

Patricio Martín

Patricio is an economist from Argentina passionate about global finance and understanding the daily movements of the markets.

More from Patricio Martín
Share:

Markets move fast. We move first.

Orange Juice Newsletter brings you expert driven insights - not headlines. Every day on your inbox.

By subscribing you agree to our Terms and conditions.

Editor's Picks

EUR/USD declines toward 1.1700 on solid USD recovery

EUR/USD turns south and declines toward 1.1700 on Wednesday. A solid comeback staged by the US Dollar weighs heavily on the pair, as traders look to USD short covering ahead of US CPI on Thursday. However, the downside could be capped by hawkish ECB expectations. 

GBP/USD slides toward 1.3300 after softer-than-expected UK inflation data

GBP/USD has come under intense selling pressure, eyeing 1.3300 in the European session on Wednesday. The UK annual headline and core CPI rose by 3.2% each, missing estimates of 3.5% and 3.4%, respectively, reaffirming dovish BoE expectations and smashing the Pound Sterling across the board. 

Gold clings to modest gains above $4,300

Following Tuesday's volatile action, Gold regains its traction on Wednesday and trades in positive territory above $4,300. While the buildup in the USD recovery momentum caps XAU/USD's upside, the cautious market stance helps ithe pair hold its ground.

Bitcoin, Ethereum and Ripple extend correction as bearish momentum builds

Bitcoin, Ethereum, and Ripple remain under pressure as the broader market continues its corrective phase into midweek. The weak price action of these top three cryptocurrencies by market capitalization suggests a deeper correction, as momentum indicators are beginning to tilt bearish.

Ukraine-Russia in the spotlight once again

Since the start of the week, gold’s price has moved lower, but has yet to erase the gains made last week. In today’s report we intend to focus on the newest round of peace talks between Russia and Ukraine, whilst noting the release of the US Employment data later on day and end our report with an update in regards to the tensions brewing in Venezuela.

AAVE slips below $186 as bearish signals outweigh the SEC investigation closure

Aave (AAVE) price continues its decline, trading below $186 at the time of writing on Wednesday after a rejection at the key resistance zone. Derivatives positioning and momentum indicators suggest that bearish forces still dominate in the near term.