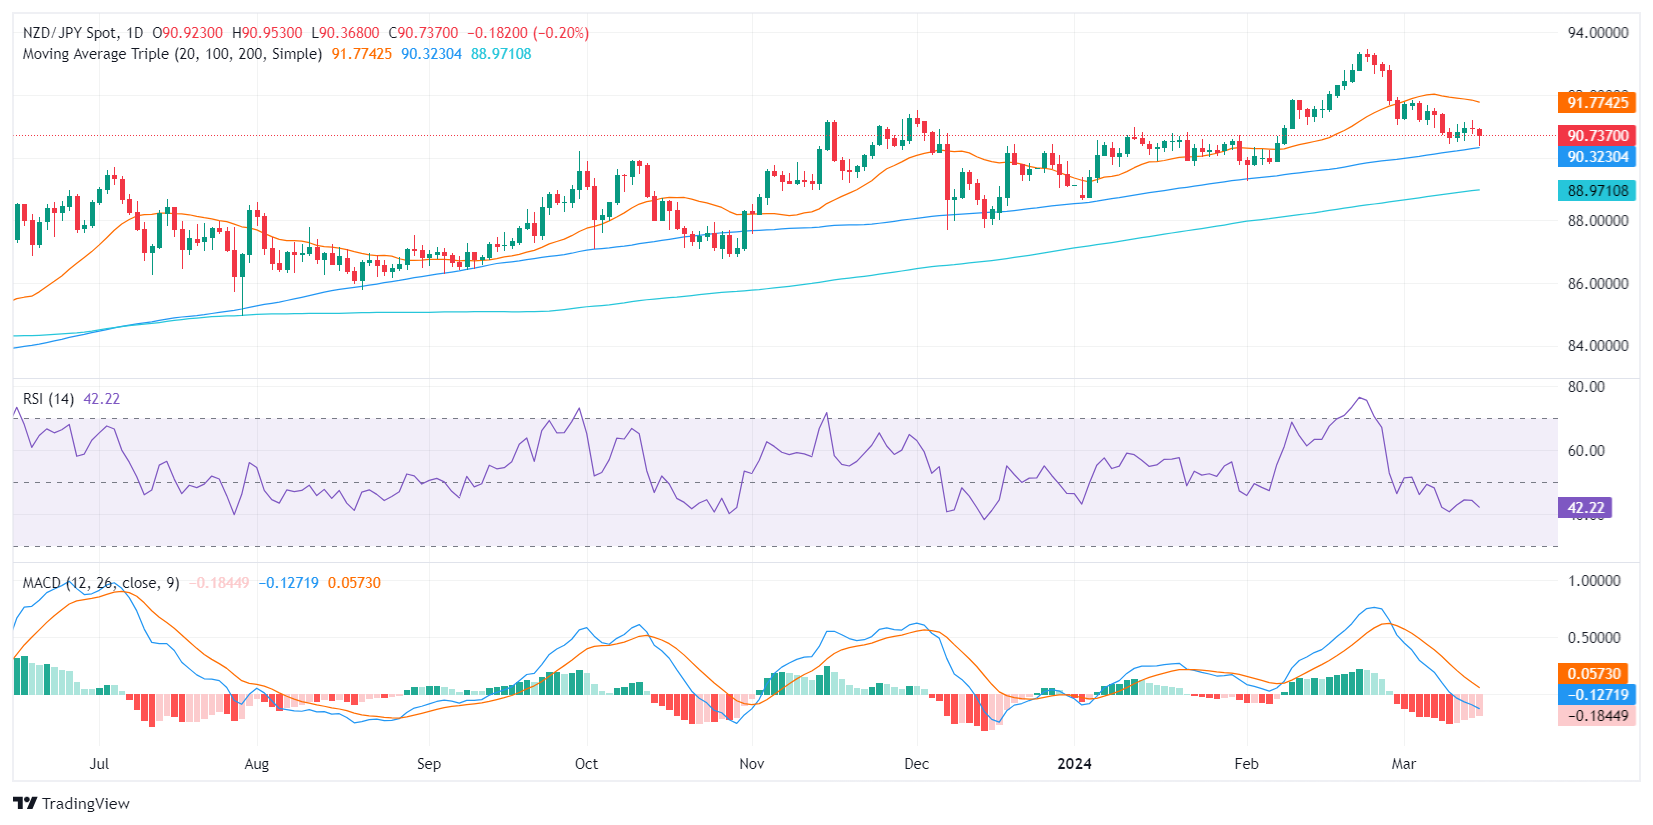
- On the daily chart, sellers remain in control despite the improvement of the RSI and MACD.
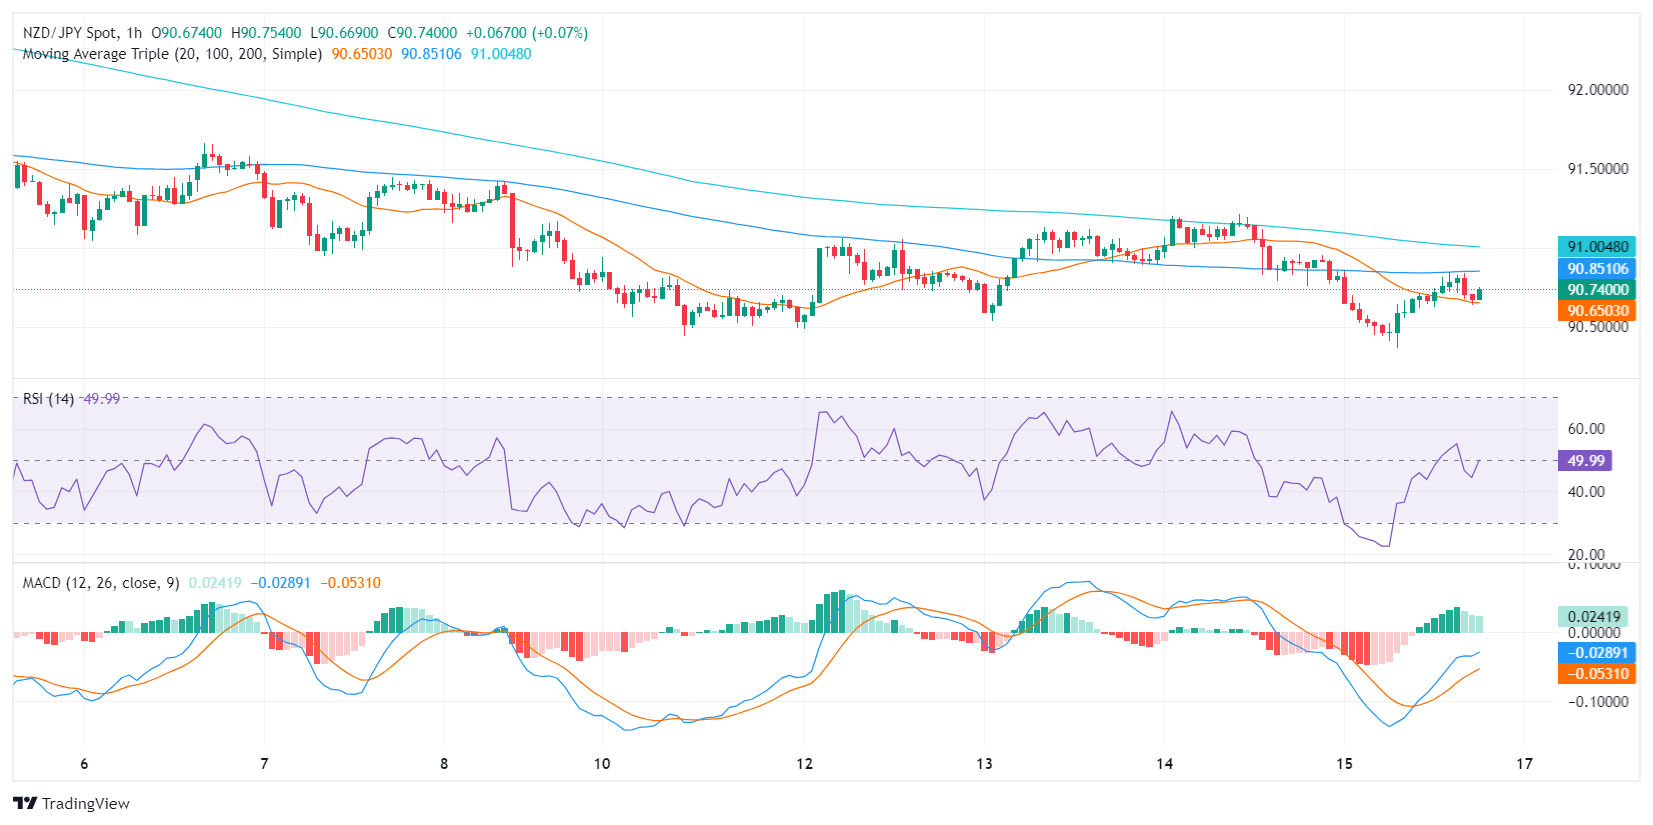
- While the daily chart emits bearish signals, the hourly indicators provide a more balanced picture, showcasing an equilibrium between buyers and sellers.
- The cross saw a recovery during the American session and managed to clear daily losses.
In Friday's session, the NZD/JPY is trading at 90.70, recording a slight loss of 0.22% after bottoming at a low of 90.35. The positioning of the pair above the key 100 and 200-day Simple Moving Averages (SMAs) might hint at bullish prospects in the overall trend, yet the shorter technical outlook tilts toward the bears as it trades below the 20-day average.
On the daily chart, the NZD/JPY's Relative Strength Index (RSI) has been in negative territory, signaling that sellers have been dominant. The Moving Average Convergence Divergence (MACD) doesn't present any brighter picture either. Its histogram has flat red bars, indicating negative momentum and a lack of buying strength.
NZD/JPY daily chart
Switching to the hourly chart, the RSI recovered towards 50, the neutral level, suggesting a balance between buyers and sellers. On the other hand, the MACD histogram displays flat green bars, indicating a steady positive momentum.
NZD/JPY hourly chart
To conclude, the broader daily analysis paints a reasonably bearish picture, with the RSI and MACD indicating seller dominance and the pair below the 20-day SMA. Yet, the hourly chart presents a somewhat mixed picture, showing a balance between buyers and sellers. Considering the pair's position above the 100 and 200-day SMAs, despite the immediate bearish sentiment, the bulls might still have a chance to regain control.
Information on these pages contains forward-looking statements that involve risks and uncertainties. Markets and instruments profiled on this page are for informational purposes only and should not in any way come across as a recommendation to buy or sell in these assets. You should do your own thorough research before making any investment decisions. FXStreet does not in any way guarantee that this information is free from mistakes, errors, or material misstatements. It also does not guarantee that this information is of a timely nature. Investing in Open Markets involves a great deal of risk, including the loss of all or a portion of your investment, as well as emotional distress. All risks, losses and costs associated with investing, including total loss of principal, are your responsibility. The views and opinions expressed in this article are those of the authors and do not necessarily reflect the official policy or position of FXStreet nor its advertisers. The author will not be held responsible for information that is found at the end of links posted on this page.
If not otherwise explicitly mentioned in the body of the article, at the time of writing, the author has no position in any stock mentioned in this article and no business relationship with any company mentioned. The author has not received compensation for writing this article, other than from FXStreet.
FXStreet and the author do not provide personalized recommendations. The author makes no representations as to the accuracy, completeness, or suitability of this information. FXStreet and the author will not be liable for any errors, omissions or any losses, injuries or damages arising from this information and its display or use. Errors and omissions excepted.
The author and FXStreet are not registered investment advisors and nothing in this article is intended to be investment advice.


Recommended content
Editors’ Picks

EUR/USD bounces off lows, retests 1.1370
Following an early drop to the vicinity of 1.1310, EUR/USD now manages to regain pace and retargets the 1.1370-1.1380 band on the back of a tepid knee-jerk in the US Dollar, always amid growing optimism over a potential de-escalation in the US-China trade war.

GBP/USD trades slightly on the defensive in the low-1.3300s
GBP/USD remains under a mild selling pressure just above 1.3300 on Friday, despite firmer-than-expected UK Retail Sales. The pair is weighed down by a renewed buying interest in the Greenback, bolstered by fresh headlines suggesting a softening in the rhetoric surrounding the US-China trade conflict.

Gold remains offered below $3,300
Gold reversed Thursday’s rebound and slipped toward the $3,260 area per troy ounce at the end of the week in response to further improvement in the market sentiment, which was in turn underpinned by hopes of positive developments around the US-China trade crisis.

Ethereum: Accumulation addresses grab 1.11 million ETH as bullish momentum rises
Ethereum saw a 1% decline on Friday as sellers dominated exchange activity in the past 24 hours. Despite the recent selling, increased inflows into accumulation addresses and declining net taker volume show a gradual return of bullish momentum.

Week ahead: US GDP, inflation and jobs in focus amid tariff mess – BoJ meets
Barrage of US data to shed light on US economy as tariff war heats up. GDP, PCE inflation and nonfarm payrolls reports to headline the week. Bank of Japan to hold rates but may downgrade growth outlook. Eurozone and Australian CPI also on the agenda, Canadians go to the polls.

The Best brokers to trade EUR/USD
SPONSORED Discover the top brokers for trading EUR/USD in 2025. Our list features brokers with competitive spreads, fast execution, and powerful platforms. Whether you're a beginner or an expert, find the right partner to navigate the dynamic Forex market.