- NZD/JPY kicks off Monday's session, operating at 91.71 with mild gains.
- On the daily chart, RSI places the NZD/JPY within the negative zone, signifying short-term rising selling traction.
- If the buyers fail to reclaim the 20-day Average, the outlook may start to turn in favor of the sellers.
In Monday's trading session, NZD/JPY is navigating around the 91.71 level, trading with mild gains. The overall market tone for the pair suggests a bearish bias as sellers remain in control, after closing a 1.70% losing week and tallying a five-day losing streak. Yet, signs of a gradual build-up of bullish momentum can be observed in the shorter timeframes.
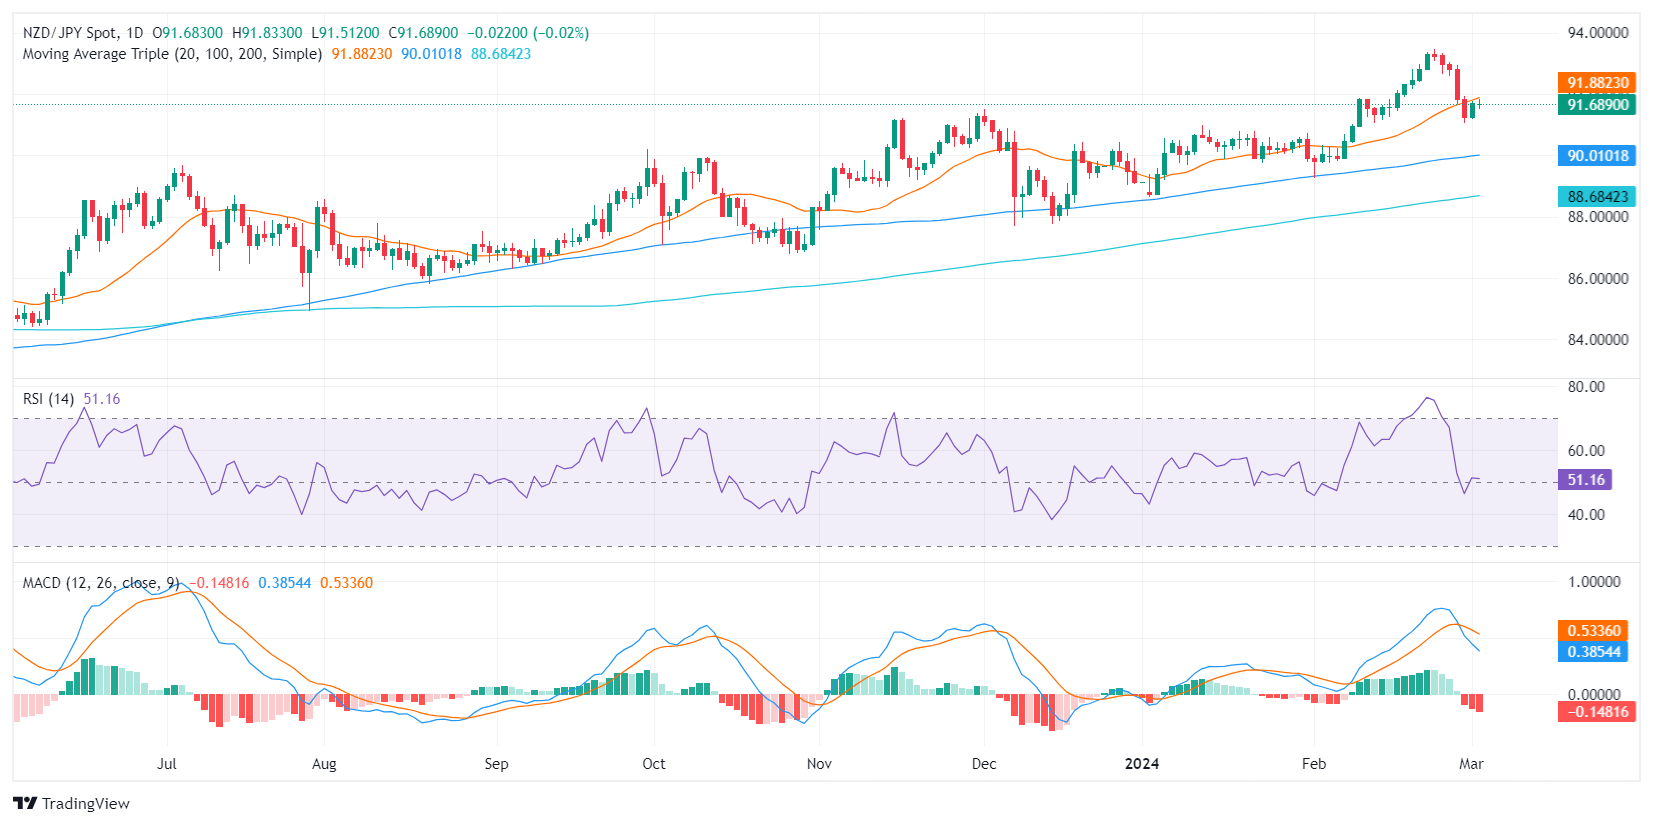
On the daily chart, the Relative Strength Index (RSI) shows the NZD/JPY pair in the negative territory, indicating bearish momentum in the short-term, as sellers control the market after hitting overbought conditions last week. The rising red bars of the Moving Average Convergence Divergence (MACD) histogram, signal that negative momentum is increasing.
NZD/JPY daily chart

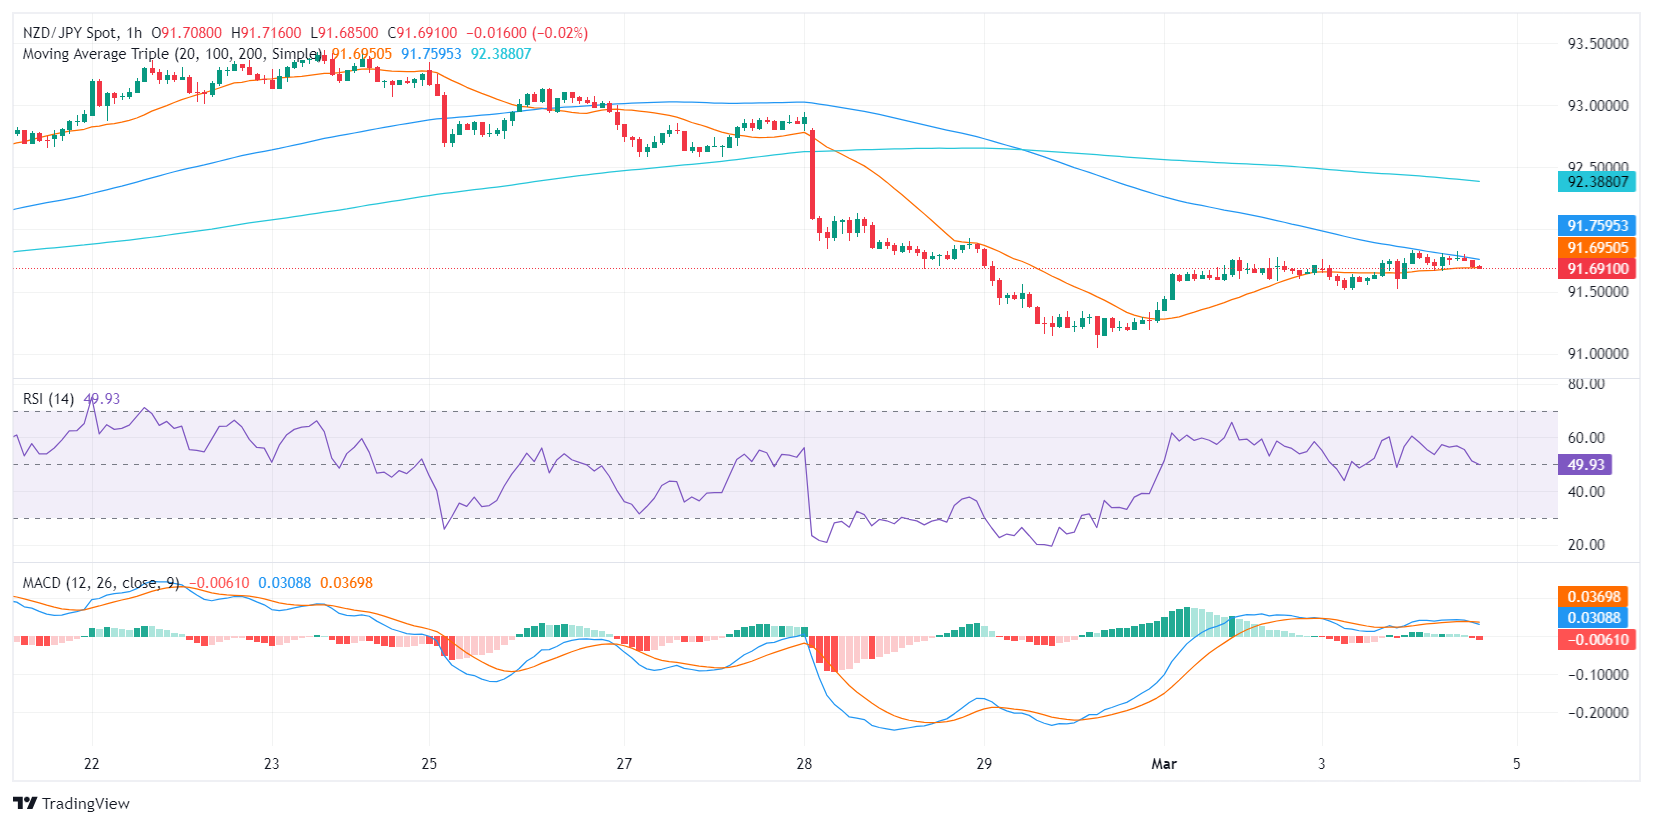
Meanwhile, on the hourly chart, the RSI is fluctuating within the positive territory, suggesting that bullish momentum may be building. However, the MACD histogram on this chart also presents rising red bars, suggesting a steady negative pull.
NZD/JPY hourly chart

In conclusion, while investors demonstrate a short-term bearish inclination on the daily chart, patterns on the hourly chart suggest that bulls are presenting a battle. That being said, the pair is holding up the 100 and 200-day Simple Moving Averages (SMAs) which typically suggest an overall bullish trend. Still, as long as the buyers fail to conquer the 20-day Average, the short-term bias will remain negative.
Information on these pages contains forward-looking statements that involve risks and uncertainties. Markets and instruments profiled on this page are for informational purposes only and should not in any way come across as a recommendation to buy or sell in these assets. You should do your own thorough research before making any investment decisions. FXStreet does not in any way guarantee that this information is free from mistakes, errors, or material misstatements. It also does not guarantee that this information is of a timely nature. Investing in Open Markets involves a great deal of risk, including the loss of all or a portion of your investment, as well as emotional distress. All risks, losses and costs associated with investing, including total loss of principal, are your responsibility. The views and opinions expressed in this article are those of the authors and do not necessarily reflect the official policy or position of FXStreet nor its advertisers. The author will not be held responsible for information that is found at the end of links posted on this page.
If not otherwise explicitly mentioned in the body of the article, at the time of writing, the author has no position in any stock mentioned in this article and no business relationship with any company mentioned. The author has not received compensation for writing this article, other than from FXStreet.
FXStreet and the author do not provide personalized recommendations. The author makes no representations as to the accuracy, completeness, or suitability of this information. FXStreet and the author will not be liable for any errors, omissions or any losses, injuries or damages arising from this information and its display or use. Errors and omissions excepted.
The author and FXStreet are not registered investment advisors and nothing in this article is intended to be investment advice.
Recommended content
Editors’ Picks
GBP/USD stays firm above 1.2750 after a landslide Labour victory

GBP/USD keeps its range above 1.2750 in early European session on Friday. The Pound Sterling stays unperturbed by the landslide Labour Party victory in the UK general election while the US Dollar awaits the Nonfarm Payrolls data for fresh directives.
EUR/USD moves above 1.0800; next barrier at upper boundary of the channel

EUR/USD continues its winning streak for the seventh successive day, trading around 1.0820 during the Asian hours on Friday. A technical analysis of the daily chart indicates a bullish bias, with the pair oscillating within an ascending channel.
Gold could retest June highs at $2,390 on US NFP disappointment

Gold price is consolidating near two-week highs of $2,365 reached on Wednesday, as the US Dollar continues to lick its wounds, shrugging off a minor bounce in the US Treasury bond yields. Gold price braces for the return of US traders from the July 4 holiday and the all-important Nonfarm Payrolls data for fresh impulse.
Top 3 Price Prediction Bitcoin, Ethereum, Ripple: Bitcoin falls below $56,000 level

BTC breached the weekly support level of $58,375 on Thursday; as of Friday, it is trading 2.8% lower at $55,314. ETH and XRP have dropped below crucial support thresholds.
Nonfarm Payrolls forecast to grow by 190K in June as Fed ponders rate-cut timing

With US Federal Reserve Chairman Jerome Powell’s Sintra appearance out of the way, all eyes now remain on top-tier Nonfarm Payrolls data for June, due on Friday at 12:30 GMT.