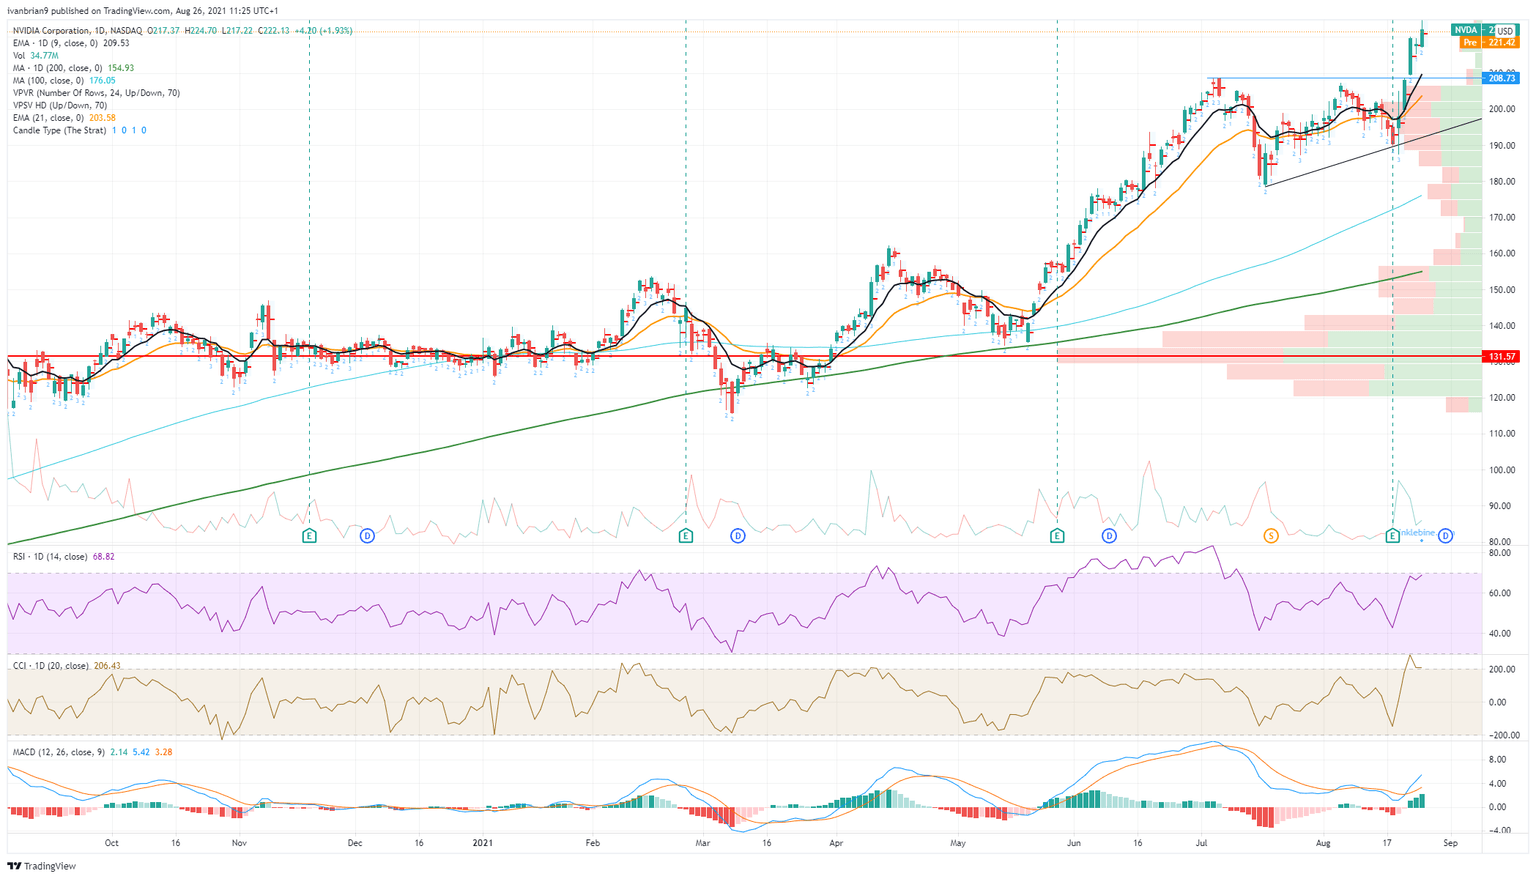
- Nvidia stock makes more all-time highs on Wednesday.
- No sign of risk-off before Jackson Hole here.
- NVDA up nearly 2% to $222.13 on Wednesday.
Nvidia stock just keeps bullishly powering ahead despite most other names settling down to wait-and-see mode ahead of the Fed's summer party at Jackson Hole, zooming straight from a screen near your local Fed member. The junket is off as it's a virtual event this year but the taper talk is likely and markets are nervous ahead of what could turn out to be a funky Friday. The Fed has to do something so it will likely opt for the least aggressive tone to try and placate and prepare markets for what is to come. The taper is over, turn off the taps!
NVDA, however, is still strongly bullish after breaking out and making all-time highs on Monday, taking it easy Tuesday before waking up on Wednesday and walking higher. A report from Reuters may have been the catalyst for this fresh move higher:
The US Department of Energy is nearing a deal to purchase a supercomputer made with chips from Nvidia Corp (NVDA.O) and Advanced Micro Devices Inc (AMD.O) as a key lab waits for a larger supercomputer from Intel Corp (INTC.O) that has been delayed for months, two people familiar with the matter told Reuters.
Nvidia closed up nearly 2% on Wednesday at $222.13.
It is always bullish when a stock reacts well to good news but overlooks bad news, which happened last week for NVDA as the UK Competition and Markets Authority outlined concerns with Nvidia's proposed purchase of British chipmaker ARM. "We're concerned that NVIDIA controlling ARM could create real problems for NVIDIA's rivals by limiting their access to key technologies and ultimately stifling innovation across a number of important and growing markets," said Andrea Coscelli, head of the Competition & Markets Authority.
NVDA statistics
Market Cap | $547 billion |
Price/Earnings | 77 |
Price/Sales | 33 |
Price/Book | 32 |
Enterprise Value | $487 billion |
Gross Margin | 0.64 |
Net Margin |
0.32 |
52-week high | $224.70 |
52-week low | $115.665 |
Average Wall Street Rating and Price Target | Buy $219.48 |
NVDA stock forecast
The breakout happened once NVDA stock got above $208.73. The entry leg of the triangle formation was from $208.73 to $178.66, a move of $30. The broad theory is that a breakout should be the size of the entry leg so in this case, our breakout target is $238.73 or thereabouts. NVDA certainly going in the right direction. Holding $208.73 is key as breakouts can retrace to test the breakout level but cannot break lower.
Like this article? Help us with some feedback by answering this survey:
Information on these pages contains forward-looking statements that involve risks and uncertainties. Markets and instruments profiled on this page are for informational purposes only and should not in any way come across as a recommendation to buy or sell in these assets. You should do your own thorough research before making any investment decisions. FXStreet does not in any way guarantee that this information is free from mistakes, errors, or material misstatements. It also does not guarantee that this information is of a timely nature. Investing in Open Markets involves a great deal of risk, including the loss of all or a portion of your investment, as well as emotional distress. All risks, losses and costs associated with investing, including total loss of principal, are your responsibility. The views and opinions expressed in this article are those of the authors and do not necessarily reflect the official policy or position of FXStreet nor its advertisers. The author will not be held responsible for information that is found at the end of links posted on this page.
If not otherwise explicitly mentioned in the body of the article, at the time of writing, the author has no position in any stock mentioned in this article and no business relationship with any company mentioned. The author has not received compensation for writing this article, other than from FXStreet.
FXStreet and the author do not provide personalized recommendations. The author makes no representations as to the accuracy, completeness, or suitability of this information. FXStreet and the author will not be liable for any errors, omissions or any losses, injuries or damages arising from this information and its display or use. Errors and omissions excepted.
The author and FXStreet are not registered investment advisors and nothing in this article is intended to be investment advice.
Recommended content
Editors’ Picks
EUR/USD trades deep in red below 1.0300 after strong US jobs report
EUR/USD stays under bearish pressure and trades below 1.0300 in the American session on Friday. The US Dollar benefits from the upbeat jobs report, which showed an increase of 256,000 in Nonfarm Payrolls, and forces the pair to stay on the back foot heading into the weekend.
GBP/USD drops toward 1.2200 on broad USD demand
GBP/USD extends its weekly slide and trades at its weakest level since November 2023 below 1.2250. The data from the US showed that Nonfarm Payrolls rose by 256,000 in December, fuelling a US Dollar rally and weighing on the pair.
Gold ignores upbeat US data, approaches $2,700
Following a drop toward $2,660 with the immediate reaction to strong US employment data for December, Gold regained its traction and climbed towards $2,700. The risk-averse market atmosphere seems to be supporting XAU/USD despite renewed USD strength.
Sui bulls eyes for a new all-time high of $6.35
Sui price recovers most of its weekly losses and trades around $5.06 at the time of writing on Friday. On-chain metrics hint at a rally ahead as SUI’s long-to-short ratio reaches the highest level in over a month, and open interest is also rising.
Think ahead: Mixed inflation data
Core CPI data from the US next week could ease concerns about prolonged elevated inflation while in Central and Eastern Europe, inflation readings look set to remain high.
Best Forex Brokers with Low Spreads
VERIFIED Low spreads are crucial for reducing trading costs. Explore top Forex brokers offering competitive spreads and high leverage. Compare options for EUR/USD, GBP/USD, USD/JPY, and Gold.