Nvidia Stock News and Forecast: NVDA stock stabilizes after Netflix (NFLX) hits tech names
- NVDA stock recovers on Monday as the tech sector was emboldened by TWTR deal.
- NDVA sees peer AMD report earnings next week on May 7.
- NVDA stock is one of 2022's underperformers as semi-conductors suffer.

Nvidia stock rallied a bit on Monday as the tech sector recovered some ground as yields eased. With Fed members now in blackout as they cannot comment 10 days before the May interest rate decision. This left the way open for bond yields to soften slightly which helped equity markets stage an afternoon recovery. Indeed the intraday 2% turnaround was also helped along as the tech sector was boosted by Elon Musk agreeing to buy Twitter (TWTR). TWTR stock closed nearly 6% higher.
NVDA stock news
One of the darlings of 2021, NVDA stock now finds itself on the backfoot for 2022. Nvidia is down 32% year to date as equities and especially high-value names take the brunt of the sell-off. NVDA stock trades on quite a high price-earnings multiple of 36 when fellow peer AMD trades on more like 23 times earnings. However, this has not stopped AMD from also shedding about 35% in 2022. Nvidia probably had more retail followers than other semiconductor stocks as NVDA has more visibility over this cohort due to its gaming experience and business sector. But to put things into context, NVDA stock's 32% loss for 2022 is contrasted with it being up 29% over the past 12 months. We should point out though that the benchmark Philadelphia Semi-Conductor Index (SOX) correlates perfectly with NVDA, showing us that this is more of a sector or industry phenomenon.
Recent earnings from Netflix while not directly related have also dented tech sentiment.
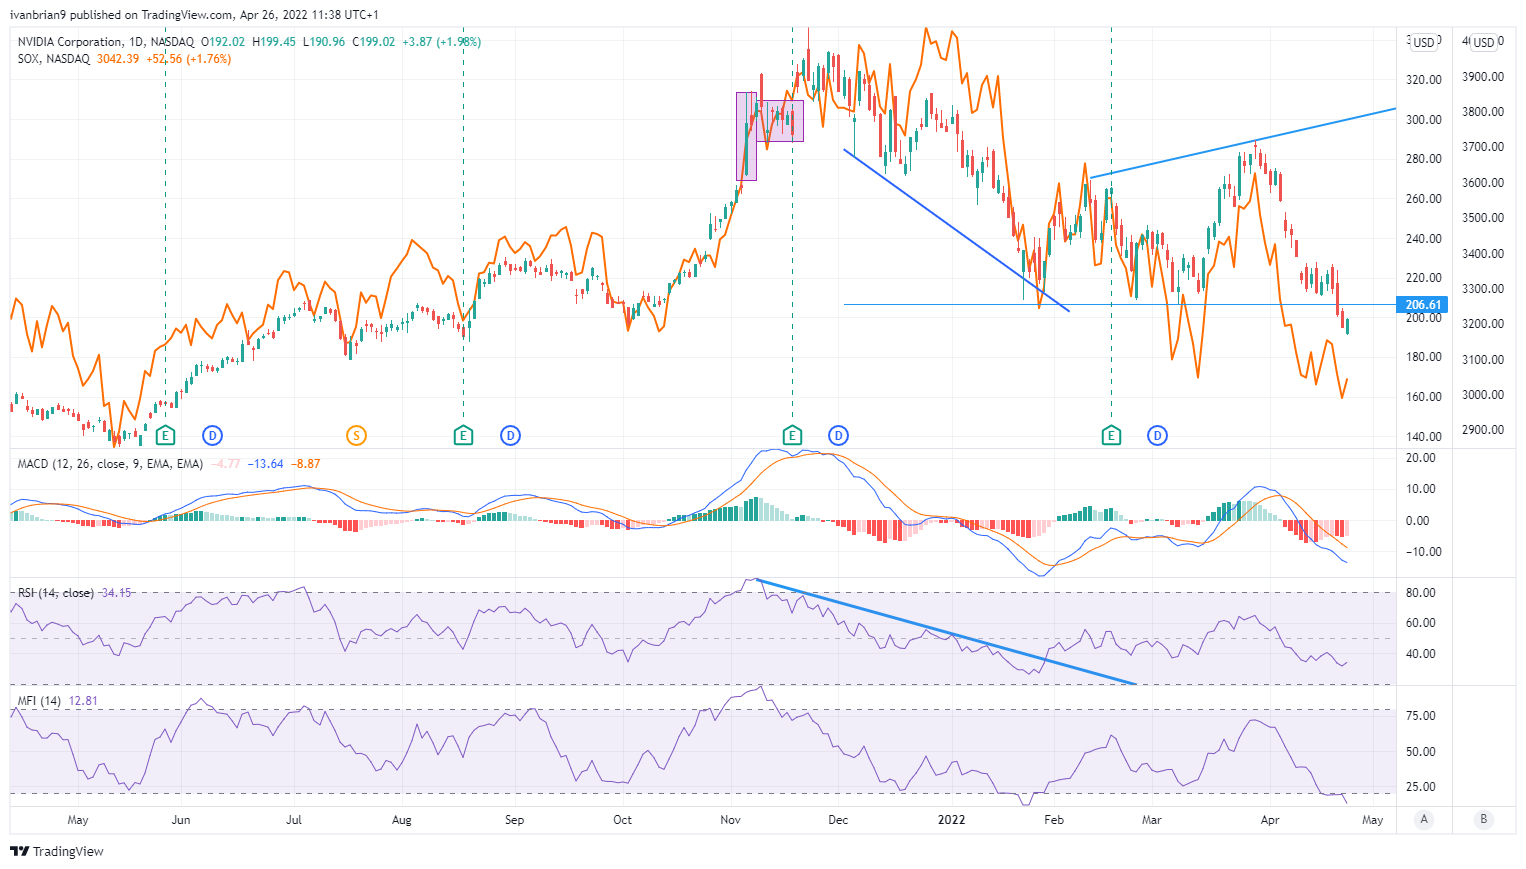
NVDA stock daily versus PHILX Semi-Conductor Index (SOX) daily-orange line
Nvidia will report earnings on May 25. Wall Street analysts are expecting earnings to hit $5.54 per share and revenue of $34.56 billion. These EPS and revenue numbers would mean changes of +24.77% and +28.42%, respectively, from a year earlier.
NVDA stock forecast
Breaking $206 was a significant support to break but a rally may not be far away if recent moves are anything to go by. Monday saw a strong intraday turnaround in equities higher and yields lower. With earnings from Apple, Google, Qualcomm, Microsoft, Facebook and Amazon this week it is a make or break for the tech sector. The Fed hawks are in a blackout so some good earnings could help stem recent losses for the sector.
The March 29 high at $ 289 was another lower high when compared to all-time highs and now breaking $206 has put in place a lower low. $206 now becomes the first resistance. $178.66 is the next support, the low from July and below a move to sub $140 cannot be ruled out as the point of control lies there. Volume is now light until we get toward $140. These levels are targeted so long as NVDA stock sits below $206. Breaking back above $206 puts us on watch for a move to the 200-day moving average at $244. As mentioned we expect a modest rally across all tech stocks and look to this week's earnings to start the rally. But tech earnings are the key factor to watch here.
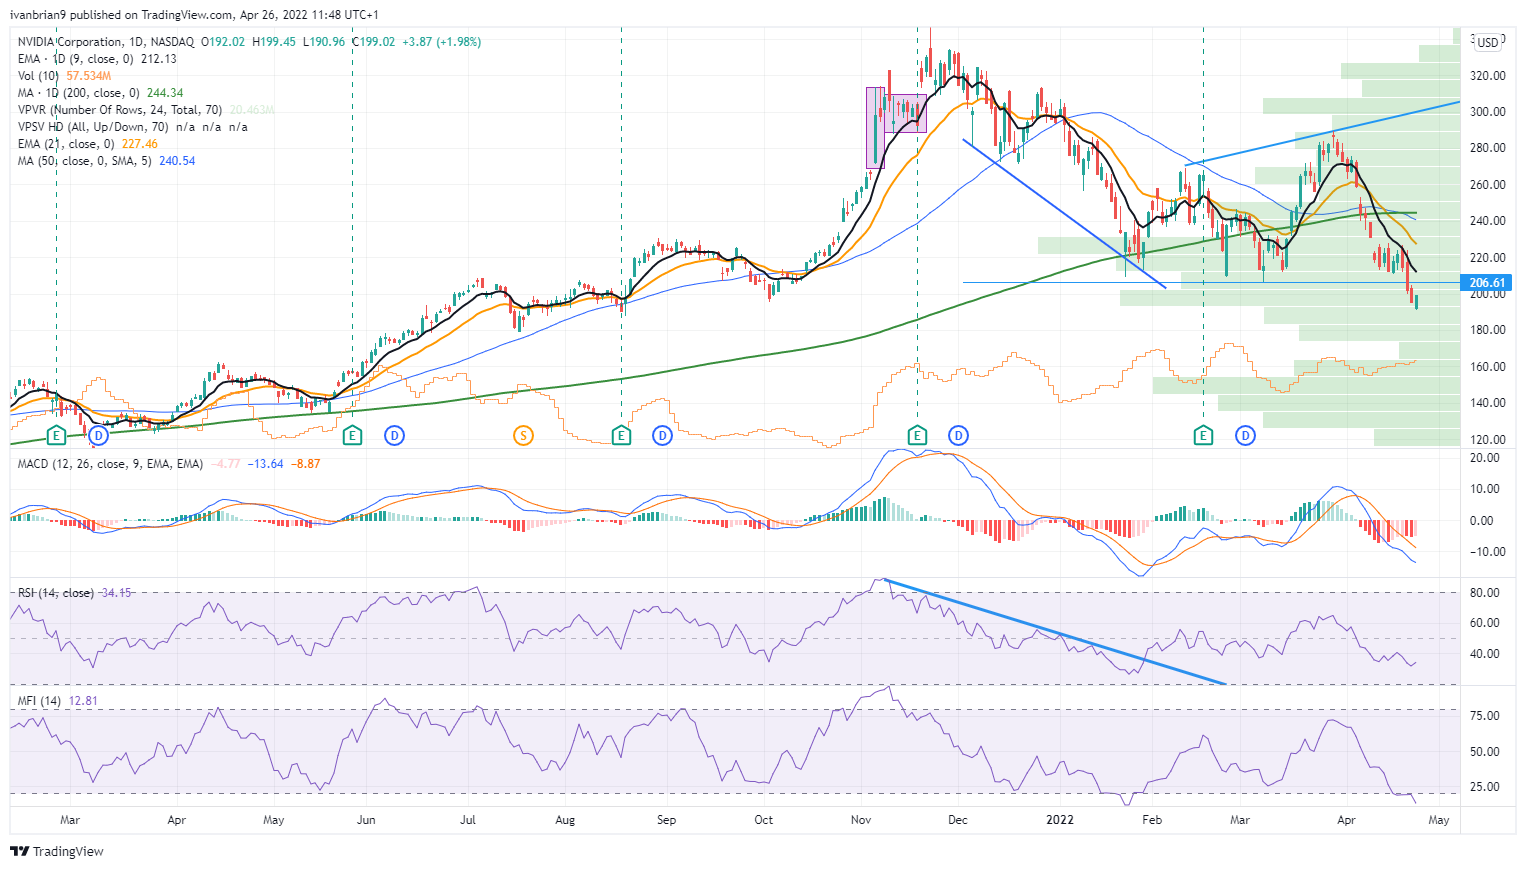
NVDA stock chart, daily
Premium
You have reached your limit of 3 free articles for this month.
Start your subscription and get access to all our original articles.
Author

Ivan Brian
FXStreet
Ivan Brian started his career with AIB Bank in corporate finance and then worked for seven years at Baxter. He started as a macro analyst before becoming Head of Research and then CFO.


