- NVDA stock crashes 6% on Tuesday in line with broad market sell-off.
- Nasdaq and other main indices finish Tuesday lower.
- Nvidia suffering a tech sector sell-off with NFLX and now GOOGL disappointing.
Tuesday saw fears mount for the health of the global economy and with a catalyst of geopolitical events in place the scene was set up for another leg lower in equities, which dragged Nvidia stock down by 6% on the day. The market had been nervous ahead of earnings from Microsoft and Google and closed lower by nearly 3% for the S&P 500 and nearly 4% for the Nasdaq. Fears over the growing conflict in Ukraine escalating did not help and news that Russia turned off the gas taps to Bulgaria and Poland also weighed on investor's minds.
The news after the bell was mixed with Google missing earnings while Microsoft reported a strong set of numbers. Tesla (TSLA) did not endear itself to index followers with a huge fall following the proposed takeover of Twitter by Elon Musk.
NVDA stock news: General headwinds hitting Nvidia
So clearly then most of Tuesday's price action was macro and geopolitical and indeed there was little news flow directly attributable to Nvidia. Things will not get any easier on Wednesday as earnings from Facebook (FB) approach. Last time out Facebook earnings led to the largest market cap loss in history so tech investors are understandably nervous.
NVDA stock forecast: Death cross exacerbates break below $206
We feel the risk-reward is skewed to the upside as negative news is now largely factored in. Anything surprising to the upside from Facebook could turn the whole stock market around. More bad earnings from Facebook will probably see a decline in the region of 3-5% but a strong report could see a 10% plus rally we believe.
Looking at the technicals, we identified $206 earlier this week as the key level and how remaining below this would lead to more losses. We did not expect to be so accurate in such a dramatic fashion but a combination of technical selling and macro related outflows did the trick. $206 remains our pivot. We also got the dreaded death cross in NVDA stock, when the 50-day moving average crosses the 200-day. Often cited as a very bearish indicator and it has worked out here.
The weekly chart below shows us the massive support at $130. The huge volume profile bar (green on the left of the chart) shows what a strong level this is. This was the staging point for the massive pandemic rally from March 2020 to November 2021. This is the target as long as NVDA stock remains below $206.
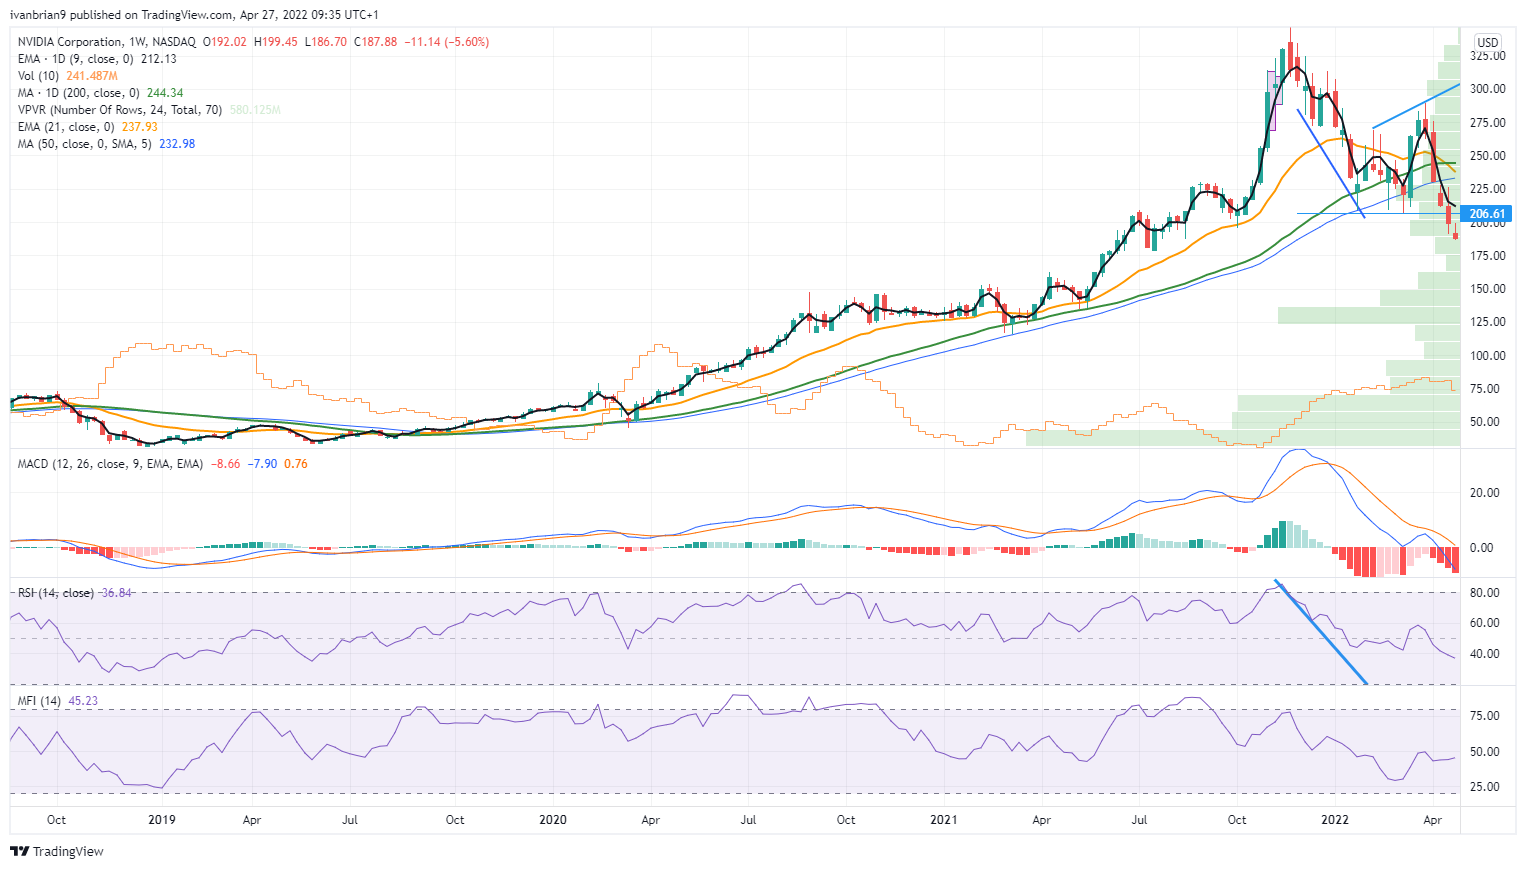
NVDA weekly chart
*The author is short Tesla.
Information on these pages contains forward-looking statements that involve risks and uncertainties. Markets and instruments profiled on this page are for informational purposes only and should not in any way come across as a recommendation to buy or sell in these assets. You should do your own thorough research before making any investment decisions. FXStreet does not in any way guarantee that this information is free from mistakes, errors, or material misstatements. It also does not guarantee that this information is of a timely nature. Investing in Open Markets involves a great deal of risk, including the loss of all or a portion of your investment, as well as emotional distress. All risks, losses and costs associated with investing, including total loss of principal, are your responsibility. The views and opinions expressed in this article are those of the authors and do not necessarily reflect the official policy or position of FXStreet nor its advertisers. The author will not be held responsible for information that is found at the end of links posted on this page.
If not otherwise explicitly mentioned in the body of the article, at the time of writing, the author has no position in any stock mentioned in this article and no business relationship with any company mentioned. The author has not received compensation for writing this article, other than from FXStreet.
FXStreet and the author do not provide personalized recommendations. The author makes no representations as to the accuracy, completeness, or suitability of this information. FXStreet and the author will not be liable for any errors, omissions or any losses, injuries or damages arising from this information and its display or use. Errors and omissions excepted.
The author and FXStreet are not registered investment advisors and nothing in this article is intended to be investment advice.


Recommended content
Editors’ Picks

AUD/USD: Extra advances look likely
AUD/USD briefly advanced to new yearly peaks near 0.6450, although it gave away all that move later in the day along with the firm performance of the US Dollar on the back of diminishing US-China trade jitters. All the attention now shifts to Australian inflation gauges due on Wednesday.

EUR/USD gathers strength to near 1.1400 ahead of German data, US PCE releases
The EUR/USD pair gains ground to near 1.1390 during the early Asian session on Wednesday. The US Dollar edges lower against the Euro due to softer-than-expected US economic data. The German economic data and US Personal Consumption Expenditures - Price Index report for March will be in the spotlight later on Wednesday.

Gold drifts lower to near $3,310 ahead of key US data releases
Gold price extends the decline to near $3,315 during the early Asian session on Wednesday. The precious metal edges lower amid easing trade tensions and better risk sentiment in global markets. Traders will keep an eye on the US ADP Employment Change, PCE and the flash Q1 GDP reports later on Wednesday.

Australia CPI expected to show inflation eased further in Q1, backing case for more rate cuts
Australia will release multiple inflation figures on Wednesday and financial markets anticipate price pressures easing further at the beginning of 2025, paving the way for additional Reserve Bank of Australia interest rate cuts.

May flashlight for the FOMC blackout period – Waiting for the fog to lift
We expect the FOMC will leave its target range for the federal funds rate unchanged at 4.25-4.50% at its upcoming meeting on May 6-7, a view widely shared by financial markets and economists. Market pricing currently implies only a 9% probability of the FOMC cutting the fed funds rate by 25 bps.

The Best brokers to trade EUR/USD
SPONSORED Discover the top brokers for trading EUR/USD in 2025. Our list features brokers with competitive spreads, fast execution, and powerful platforms. Whether you're a beginner or an expert, find the right partner to navigate the dynamic Forex market.