Nvidia Stock Chart: Following new export controls, NVDA could decline by 18% to $328


  • Nvidia could lose out on more than $5 billion in sales to China.
  • Wall Street Journal: Biden administration’s export controls on AI chips already in effect.
  • NVDA stock has broken through the neckline of a head-and-shoulders chart pattern.
  • AMD announces quarterly results after the market close on Tuesday.


Nvidia (NVDA) stock has broken through the neckline of its head-and-shoulders technical pattern on the daily chart, meaning that investors should expect a major 18% decline to near $328.

The pattern appears more likely to ensue now that NVDA stock is being pressured following a Wall Street Journal report that the Biden administration’s export controls could curb more than $5 billion worth of Nvidia chips sales to China.

Nvidia stock news: AI chip curbs immediate, says Biden administration

The Wall Street reported on Tuesday that President Joe Biden’s administration told Nvidia officials last week that the previously announced export restrictions on state-of-the-art chips used for AI workloads – including Nvidia’s A100 and H100 GPUs used in generative AI – were immediately in effect.

The Journal spoke with company executives close to the matter who said Nvidia had planned to ship next year’s batch of orders to Chinese customers in mid-November, in order to front run the new rules, but now could lose out on more than $5 billion in 2024 sales.

Nvidia’s stock gave up more than 2% on the news this Tuesday and has finally lost its trillion-dollar market cap. Nvidia reached the $1 trillion mark earlier this year after its revenue guidance exploded higher on a flurry of orders relating to the generative AI industry. Nvidia is widely thought to offer the highest value chips for generative AI workloads.

Traders are still keeping their eyes on Advanced Micro Devices (AMD) earnings that arrive after Tuesday’s market close. Wall Street consensus expects AMD to post earnings of $0.68 per adjusted share on $5.69 billion in sales.

Nvidia stock forecast: Head-and-shoulders chart pattern calls for $328 target

The daily chart below offers up a textbook head-and-shoulders pattern. The “head” came on August 24 at an all-time high of $502.66. The pinnacle of each “shoulder” gave up in mid-July and mid-October in the area between $476 and $481.

The neckline of the chart pattern starts at the August 14 bottom at $403.11 and rises through the September 21 bottom at $409.80. This means that NVDA stock broke through the neckline on Thursday, October 26, just above $415.

Head-and-shoulders patterns are bearish signals, and the price target comes from the difference between the top of the head ($502.66) and the neckline break (~$415.50). This conjures up an $87 downside movement that is expected to curtail near $328.

Nvidia reached resistance in the vicinity of $328 back in November 2021, although that rally did momentarily climb above $346. Another more recent point of historical resistance is the $318.28 high from May 18, earlier this year.


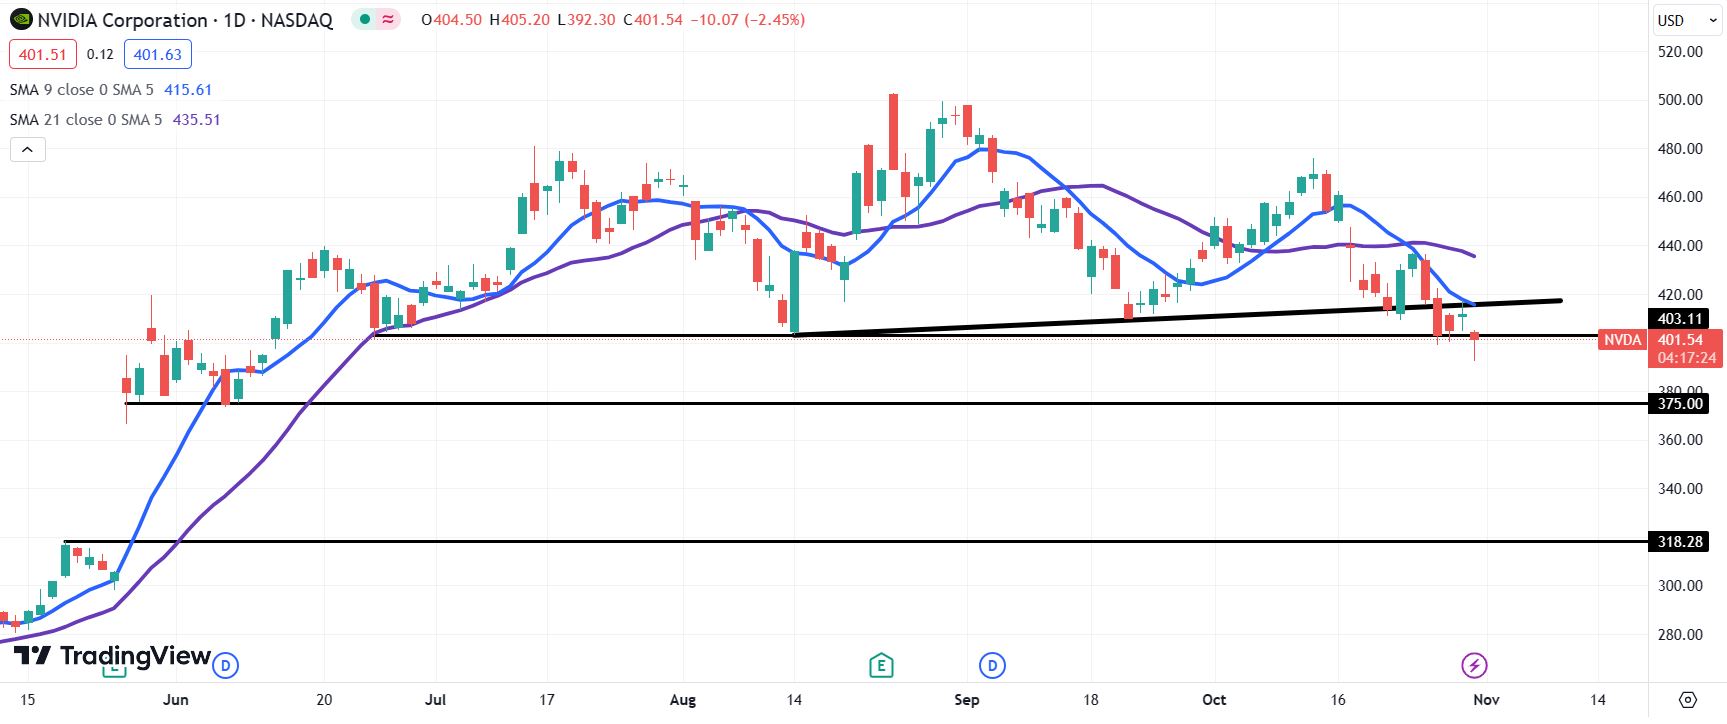
NVDA daily stock chart


Share: Feed news

Information on these pages contains forward-looking statements that involve risks and uncertainties. Markets and instruments profiled on this page are for informational purposes only and should not in any way come across as a recommendation to buy or sell in these assets. You should do your own thorough research before making any investment decisions. FXStreet does not in any way guarantee that this information is free from mistakes, errors, or material misstatements. It also does not guarantee that this information is of a timely nature. Investing in Open Markets involves a great deal of risk, including the loss of all or a portion of your investment, as well as emotional distress. All risks, losses and costs associated with investing, including total loss of principal, are your responsibility. The views and opinions expressed in this article are those of the authors and do not necessarily reflect the official policy or position of FXStreet nor its advertisers. The author will not be held responsible for information that is found at the end of links posted on this page.

If not otherwise explicitly mentioned in the body of the article, at the time of writing, the author has no position in any stock mentioned in this article and no business relationship with any company mentioned. The author has not received compensation for writing this article, other than from FXStreet.

FXStreet and the author do not provide personalized recommendations. The author makes no representations as to the accuracy, completeness, or suitability of this information. FXStreet and the author will not be liable for any errors, omissions or any losses, injuries or damages arising from this information and its display or use. Errors and omissions excepted.

The author and FXStreet are not registered investment advisors and nothing in this article is intended to be investment advice.

Recommended content


Recommended content

Editors’ Picks

EUR/USD extends slide toward 1.1000 on broad USD strength

EUR/USD extends slide toward 1.1000 on broad USD strength

EUR/USD stays under bearish pressure and trades at a fresh multi-week low below 1.1050 on Thursday. The upbeat ISM Services PMI data for September boosts the US Dollar, while rising bets for an ECB rate cut in October undermine the Euro. 

EUR/USD News
GBP/USD tests multi-week lows near 1.3100 after Bailey's dovish remarks

GBP/USD tests multi-week lows near 1.3100 after Bailey's dovish remarks

GBP/USD loses more than 1% and trades at around 1.3100, pressured by dovish comments from BoE Governor Andrew Bailey, who said that the central bank could become 'more activist' on rate cuts if inflation eases. On the other hand, the USD benefits from strong PMI data.

GBP/USD News
Gold struggles to gain traction, trades below $2,650

Gold struggles to gain traction, trades below $2,650

Gold oscillates in a tight range below $2,650 after bets fade that the Fed will continue slashing interest rates aggressively. Although XAU/USD finds support from increasing geopolitical risks, the broad USD strength doesn't allow the pair to stage a rebound.

Gold News
XRP takes a hit as traders digest SEC appeal in Ripple lawsuit

XRP takes a hit as traders digest SEC appeal in Ripple lawsuit

XRP extended its losing streak on Thursday. The asset slipped to $0.5208 as traders digested the recent developments in the SEC lawsuit. The US financial regulator’s decision to file an appeal on Thursday of the Ripple lawsuit has invited criticism from Ripple executives and XRP holders. 

Read more
RBA widely expected to keep key interest rate unchanged amid persisting price pressures

RBA widely expected to keep key interest rate unchanged amid persisting price pressures

The Reserve Bank of Australia is likely to continue bucking the trend adopted by major central banks of the dovish policy pivot, opting to maintain the policy for the seventh consecutive meeting on Tuesday.

Read more
Five best Forex brokers in 2024

Five best Forex brokers in 2024

VERIFIED Choosing the best Forex broker in 2024 requires careful consideration of certain essential factors. With the wide array of options available, it is crucial to find a broker that aligns with your trading style, experience level, and financial goals. 

Read More

Forex MAJORS

Cryptocurrencies

Signatures