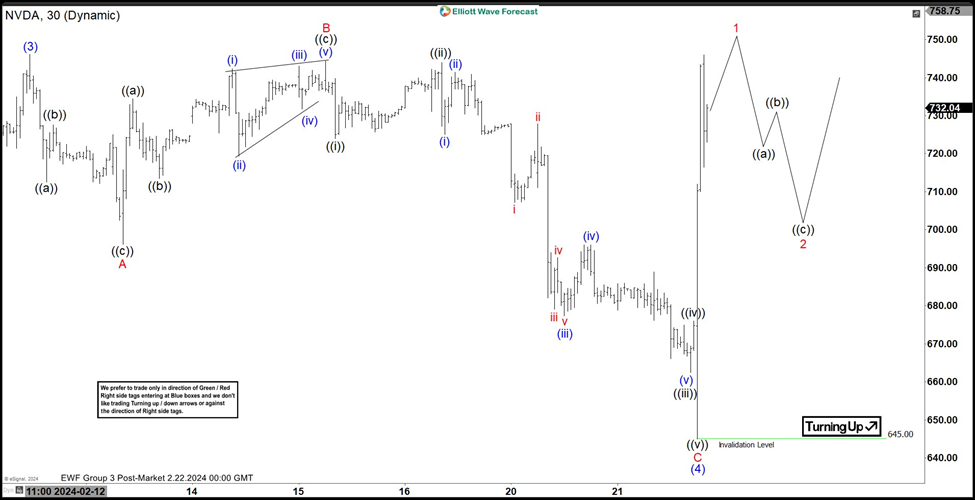
Short Term Elliott Wave View in Nvidia (NVDA) suggests that the rally from 12.4.2023 low is in progress as a 5 waves impulse. Up from 12.4.2023 low, wave (1) ended at 504.33 and pullback in wave (2) ended at 473.20. The stock rallied higher in wave (3) which ended at 746.11. Wave (4) pullback ended at 465 with internal subdivision as a flat Elliott Wave structure.
Nvidia (NVDA) 45 minutes Elliott Wave chart
Down from wave (3), wave ((a)) ended at 712.5 and wave ((b)) ended at 727.63. Wave ((c)) lower ended at 696.20 which completed wave A in higher degree. Up from there, wave ((a)) ended at 734.5 and wave ((b)) ended at 713.50. Wave ((c)) higher ended at 744.33 which completed wave B in higher degree. The stock then turned lower in 5 waves impulse. Down from wave B, wave ((i)) ended at 724 and wave ((ii)) ended at 744.02. Wave ((iii)) lower ended at 662.48 and wave ((iv)) ended at 676.
Final leg wave ((v)) ended at 645 which completed wave C of (4). The stock has turned higher in wave (5). Up from wave (4), wave 1 of (5) should end soon, then it should pullback in wave 2 of (5) before the stock resumes higher. Near term, as far as pivot at 645 low stays intact, expect pullback to find support in 3, 7, 11 swing for further upside.
NVDA Elliott Wave video
FURTHER DISCLOSURES AND DISCLAIMER CONCERNING RISK, RESPONSIBILITY AND LIABILITY Trading in the Foreign Exchange market is a challenging opportunity where above average returns are available for educated and experienced investors who are willing to take above average risk. However, before deciding to participate in Foreign Exchange (FX) trading, you should carefully consider your investment objectives, level of xperience and risk appetite. Do not invest or trade capital you cannot afford to lose. EME PROCESSING AND CONSULTING, LLC, THEIR REPRESENTATIVES, AND ANYONE WORKING FOR OR WITHIN WWW.ELLIOTTWAVE- FORECAST.COM is not responsible for any loss from any form of distributed advice, signal, analysis, or content. Again, we fully DISCLOSE to the Subscriber base that the Service as a whole, the individual Parties, Representatives, or owners shall not be liable to any and all Subscribers for any losses or damages as a result of any action taken by the Subscriber from any trade idea or signal posted on the website(s) distributed through any form of social-media, email, the website, and/or any other electronic, written, verbal, or future form of communication . All analysis, trading signals, trading recommendations, all charts, communicated interpretations of the wave counts, and all content from any media form produced by www.Elliottwave-forecast.com and/or the Representatives are solely the opinions and best efforts of the respective author(s). In general Forex instruments are highly leveraged, and traders can lose some or all of their initial margin funds. All content provided by www.Elliottwave-forecast.com is expressed in good faith and is intended to help Subscribers succeed in the marketplace, but it is never guaranteed. There is no “holy grail” to trading or forecasting the market and we are wrong sometimes like everyone else. Please understand and accept the risk involved when making any trading and/or investment decision. UNDERSTAND that all the content we provide is protected through copyright of EME PROCESSING AND CONSULTING, LLC. It is illegal to disseminate in any form of communication any part or all of our proprietary information without specific authorization. UNDERSTAND that you also agree to not allow persons that are not PAID SUBSCRIBERS to view any of the content not released publicly. IF YOU ARE FOUND TO BE IN VIOLATION OF THESE RESTRICTIONS you or your firm (as the Subscriber) will be charged fully with no discount for one year subscription to our Premium Plus Plan at $1,799.88 for EACH person or firm who received any of our content illegally through the respected intermediary’s (Subscriber in violation of terms) channel(s) of communication.
Recommended content
Editors’ Picks

AUD/USD holds solid-Aussie jobs data-led gains above 0.6400
AUD/USD holds sizeable gains above 0.6400 early Thursday, capitalizing on stellar Australian jobs data, which pointed to a still resilient labour market and forced investors to scale back their bets for a rate cut by the RBA in February.

USD/JPY extends losses to near 152.00 amid risk-aversion, US Dollar retreat
USD/JPY drifts lower to near 152.00 in Thursday's Asian trading, snapping a three-day winning streak to a two-week high.The pair remains weighed down by a broad US Dollar pullback, risk-aversion and uncertainty around the BoJ rate hike next week. Focus shifts to US data.

Gold buyers pause near five-week high, awaits US data
Gold price pauses its bullish momemtun early Thursday, having benefitted from the likelihood of a Fed rate cut next week. Furthermore, geopolitical risks and trade war fears remain supportive of the traditonal safe-haven Gold price.

Ripple's XRP could extend its rally to $4.75 after recent consolidation, rising profit-taking poses threat
Ripple's XRP continued its rally on Wednesday as it looks to test the upper boundary of a key flag channel. Following the recent price rise, investors booked profits worth nearly $800 million while options traders bet on the remittance-based token hitting the $5 mark.

BTC faces setback from Microsoft’s rejection
Bitcoin price hovers around $98,400 on Wednesday after declining 4.47% since Monday. Microsoft shareholders rejected the proposal to add Bitcoin to the company’s balance sheet on Tuesday.

Best Forex Brokers with Low Spreads
VERIFIED Low spreads are crucial for reducing trading costs. Explore top Forex brokers offering competitive spreads and high leverage. Compare options for EUR/USD, GBP/USD, USD/JPY, and Gold.
