Nvidia (NVDA) buying the dips after Elliott Wave double three pattern

Hello fellow traders. In this technical article we’re going to take a look at the Elliott Wave charts charts of NVIDIA (NVDA) Stock published in members area of the website. Our members are aware of the numerous positive trading setups we’ve had among Stocks and Indices recently. One of them is NVIDIA , which made a pullback, that unfolded as an Elliott Wave Double Three Pattern. It completed clear 7 swings from the peak on March 8th peak and concluded the correction right at the Equal Legs zone (Blue Box Area). In the following text, we’ll delve into the Elliott Wave pattern and trading setup.
Before we take a look at the real market example, let’s explain Elliott Wave Double Three pattern.
Elliott Wave double three pattern
Double three is the common pattern in the market , also known as 7 swing structure. It’s a reliable pattern which is giving us good trading entries with clearly defined invalidation levels.
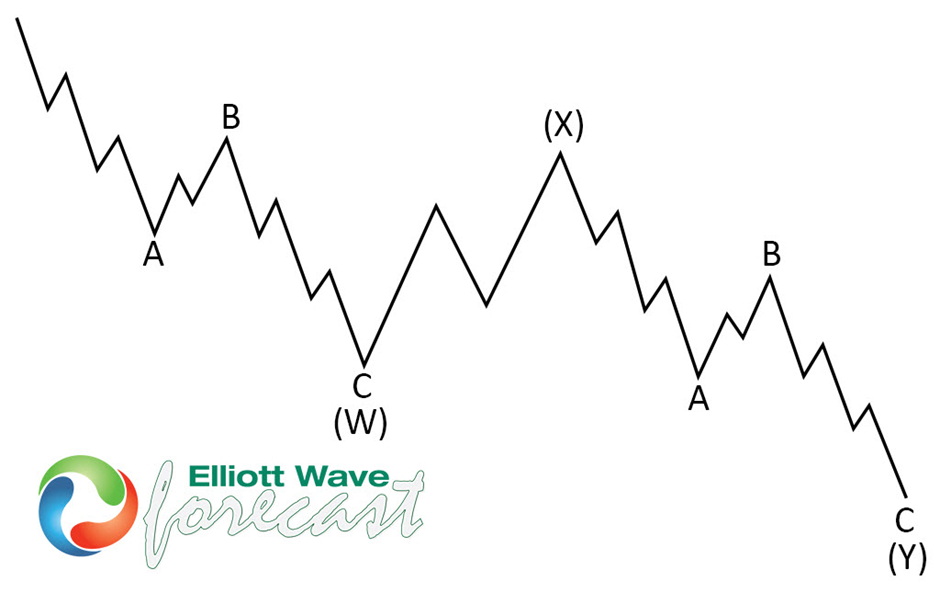
The picture below presents what Elliott Wave Double Three pattern looks like. It has (W),(X),(Y) labeling and 3,3,3 inner structure, which means all of these 3 legs are corrective sequences. Each (W) and (Y) are made of 3 swings , they’re having A,B,C structure in lower degree, or alternatively they can have W,X,Y labeling.
NVDA H4 weekend update 04.21.2024
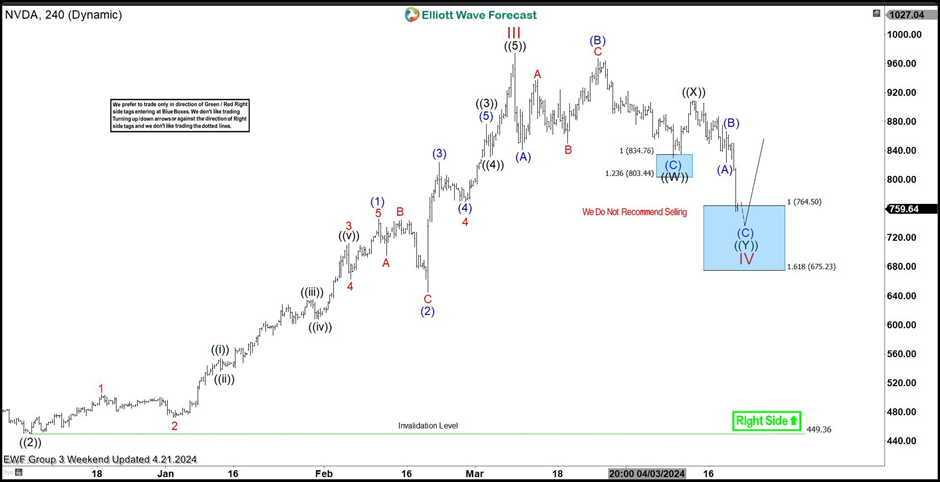
NVDA is currently in a wave IV red correction, unfolding in a 7-swing pattern. We’ve labeled the pullback as ((W)))((X))((Y)) in black. The first leg, ((W)) in black, shows a clear 3-wave structure (A)(B)(C) in blue, followed by a 3-wave bounce in ((X)) black. We anticipate the pullback to form a Double Three pattern, projecting 3 waves in ((Y)) black. The price has hit the extreme zone, marked by the blue box, and we know the correction could end anytime. We expect the stock to rally toward new highs or bounce in 3 waves. When the price retraces to the 50% Fibonacci level against the ((X)) black connector, we’ll secure positions, set the stop loss at breakeven, and take partial profits.
Official trading strategy on How to trade 3, 7, or 11 swing and equal leg is explained in details in Educational Video.
Quick reminder on how to trade our charts:
Red bearish stamp+ blue box = Selling Setup
Green bullish stamp+ blue box = Buying Setup
Charts with Black stamps are not tradable.
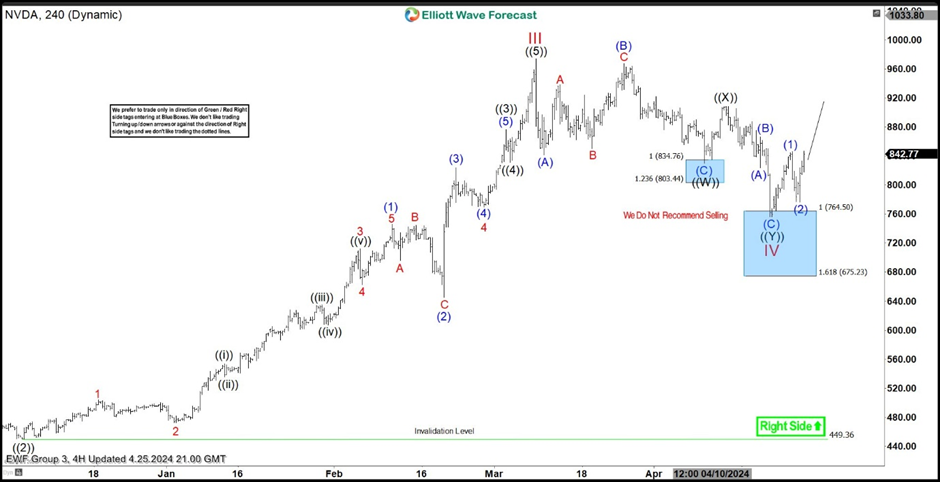
NVDA H4 weekend update 04.25.2024
NVDA stock found buyers as expected and made a decent rally from the Blue Box. The bounce has already reached the 50% Fibonacci retracement level against the ((X)) black connector, confirming that the cycle from the peak is complete. Consequently, any long positions taken from the equal legs area are now risk-free, and we have already taken partial profits. We consider wave IV red completed at the 756.27 low.
Keep in mind not every chart is trading recommendation.
Author

Elliott Wave Forecast Team
ElliottWave-Forecast.com


