Nvidia drops below $111 despite Wall Street acknowledging its product lead on AMD
- NVDA stock sheds weight on Thursday morning.
- Trump's auto tariffs send most automakers lower.
- Goods Trade Balance deficit for February prints larger than consensus.
- NVDA stock continues to trade in a bearish Death Cross pattern.
Nvidia (NVDA) stock was shunted another 2.5% lower on Thursday despite investment bank Jefferies publishing a client note showing Nvidia’s increased AI product lead on competitor Advanced Micro Devices (AMD).
NVDA shares fell below the $111 level, helping the Dow Jones Industrial Average (DJIA) sink 0.2%. The S&P 500 shed a similar percentage, while the NASDAQ sank closer to 0.4% in the first half hour on Thursday.
US economic data has been largely unsurprising on Thursday, but the preliminary Goods Trade Balance for February underperformed expectations, coming in as it did at $-147.9 billion rather than the $-134.5 billion consensus.
The reading might have been affected by US firms attempting to import larger stockpiles ahead of the Trump administration’s tariffs taking full effect. In the lead up to the White House’s proposed Liberation Day on April 2, when the administration is scheduled to unveil further tariffs and reinstate some delayed tariffs, Trump announced auto industry tariffs late Wednesday that will apply to all foreign countries shipping finished vehicles and parts to the US.
The auto tariffs, which begin at 2.5% and scale up to 25% over time, have already damaged the share prices of many global automakers on Thursday. General Motors (GM) stock caved more than 8% early on Thursday, while Tesla (TSLA) stock advanced 4%. In addition, Trump used social media to threaten worse tariffs on Canada and the European Union (EU).
Nvidia stock news
Jefferies analyst Blayne Curtis said in a note on Thursday that research conducted in-house suggests that the gap in performance between Nvidia’s AI chips and those of AMD are even larger than earlier claims.
“Our proprietary benchmarking report suggests real-world throughput of NVDA’s H200 across a range of open-source models is substantially higher than AMD’s MI300x, despite MI300x’s higher advertised TFLOPs and memory bandwidth,” wrote Curtis in a client note.
What’s more, Curtis suggests that this gap will only grow when Nvidia’s Blackwell and Blackwell Ultra GPUs reach wider use. The company’s H200 or Hopper line of GPUs was released in 2023.
“A valid pushback would be that the AMD solution is not as well optimized for the models we tested, but we view this as exactly the point,” Curtis explained. “These results underscore the importance of NVDA’s mature software stack for managing GPU efficiencies, and this gap will widen.”
At Nvidia’s GTC conference earlier this month, CEO Jensen Huang recounted that Nvidia sold 1.3 million Hopper GPUs to the top four hyperscalers — Amazon, Microsoft, Alphabet and Oracle — in 2024. Meanwhile, Huang said his company had already sold 3.6 million Blackwell GPUs to these same firms, even though the product only began shipping last autumn.
Even worse for AMD, Nvidia has a roadmap to expand on its lead in AI-specific chips. The next generation of AI GPUs, the Blackwell Ultra, is slated for release in the second half of this year. Then, the Rubin line will arrive in late 2026, followed by the Rubin Ultra in late 2027, and the Feynman line scheduled for sometime in 2028.
Jeffereries cut its rating on AMD stock from Buy to Hold, trimming its price target from $135 to $120.
Nvidia stock forecast
The major focus of Nvidia's daily chart remains its recent initiation of a Death Cross pattern. A Death Cross is when the 50-day Simple Moving Average (SMA) drops below the 200-day SMA, which happened for Nvidia on March 20, and it typically foreshadows that a lengthy pullback is coming.
Second, another bearish occurrence has been NVDA stock trading beneath the ascending trendline range (colored in light green), which supports Nvidia's long rally beginning in October 2023 and lasting through the end of February 2025.
Despite Jefferies' suggestion that Nvidia's technology lead is insurmountable at present, the chart tells us that this rally has played out. It would seem that all this talk of tariffs hangs heavy on Nvidia due to worries of this trade policy causing slower global economic growth or even recession.
In the short term, Nvidia needs to regain the $115 threshold in order to remove itself from short-term negative technicals. However, since Thursday's low dropped beneath the March 3 range low, a retest of the $105 support level would seem more likely.
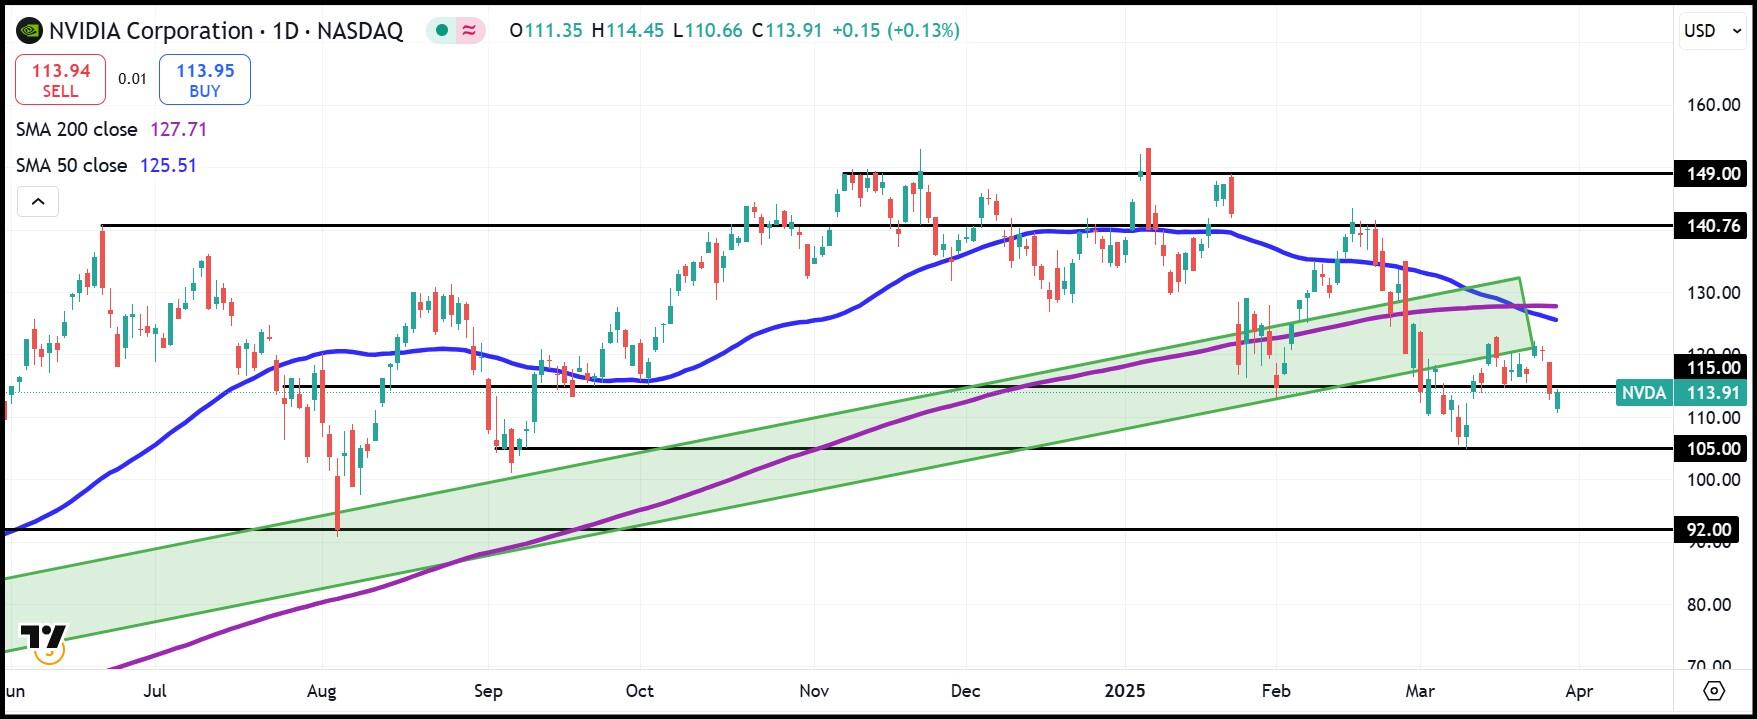
NVDA daily stock chart
Premium
You have reached your limit of 3 free articles for this month.
Start your subscription and get access to all our original articles.
Author

Clay Webster
FXStreet
Clay Webster grew up in the US outside Buffalo, New York and Lancaster, Pennsylvania. He began investing after college following the 2008 financial crisis.