Nvidia Corp (NVDA) stocks Elliott Wave technical analysis [Video]
![Nvidia Corp (NVDA) stocks Elliott Wave technical analysis [Video]](https://editorial.fxstreet.com/images/Markets/Equities/Industries/Transportation/pic-airplane-engine-637435357526453004_XtraLarge.jpg)
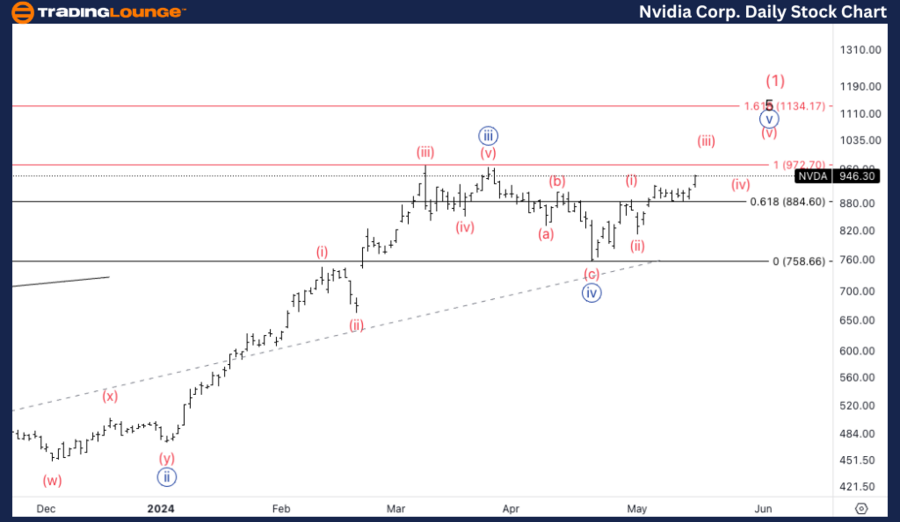
NVDA Elliott Wave Analysis Trading Lounge Daily Chart,
Nvidia Corp., (NVDA) Daily Chart.
NVDA Elliott Wave technical analysis
Function: Trend.
Mode: Impulsive.
Structure: Motive.
Position: Minute {v}.
Direction: Upside in wave (iii).
Details: Equality of {v} vs. {i} stands at 972$, looking for resistance on top of TL1 at 1000$.
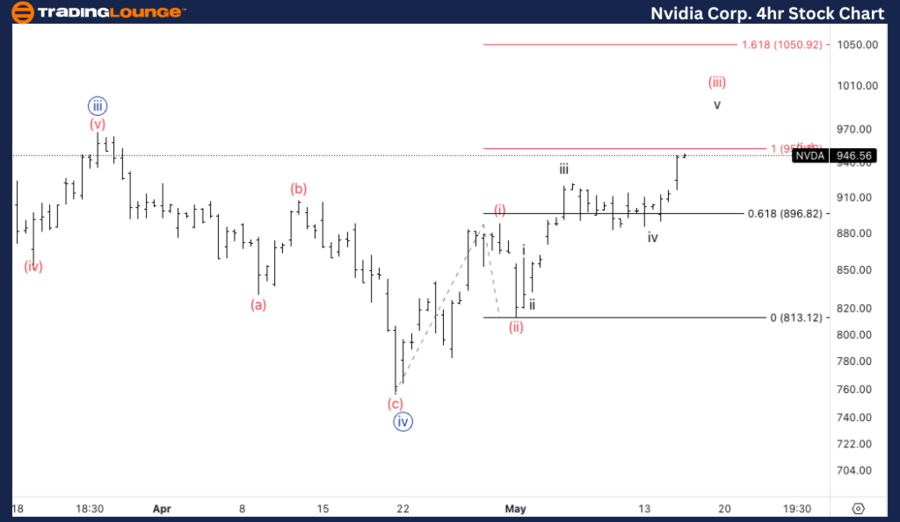
NVDA Elliott Wave Analysis Trading Lounge 4Hr Chart,
Nvidia Corp., (NVDA) 4Hr Chart.
NVDA Elliott Wave technical analysis
Function: Trend.
Mode: Impulsive.
Structure: Motive.
Position: Wave v of (iii).
Direction: Upside in wave v.
Details: We are close to equality of (iii) vs. (i), 1.618 (iii) vs. (i) stands at 1050$.
Dive into our latest Elliott Wave analysis for NVIDIA (NVDA) Discover key price targets and potential resistance levels in our detailed NVDA stock forecast. Explore how wave patterns suggest significant movements ahead.
NVDA Elliott Wave technical analysis – Daily chart
According to the latest daily chart insights, NVIDIA is currently in Minute wave {v} of a larger wave (iii). This suggests a continuation of the upward momentum in the stock's price. Notably, the equality of wave {v} with wave {i} is projected at $972, indicating where the next significant resistance could form. Additionally, traders should be vigilant as we approach the $1000 mark, coinciding with resistance at Trading Level 1 (TL1).
NVDA Elliott Wave technical analysis – Four hore chart
The 4-hour chart refines our understanding, showing NVIDIA in the fifth wave of wave (iii). This segment of the analysis reveals a more immediate bullish.
Technical analyst: Alessio Barretta.
NVDA Elliott Wave technical analysis [Video]
Author

Peter Mathers
TradingLounge
Peter Mathers started actively trading in 1982. He began his career at Hoei and Shoin, a Japanese futures trading company.


