NVDA: Weekly blue box may lead towards new highs

in this article we will analyze the Weekly cycle of NVDA. Everyone more or less is familiar with the company. Nvidia Corporation is an American multinational technology company incorporated in Delaware and based in Santa Clara, California. It is a software and fabless company which designs graphics processing units (GPUs).
Additionally, application programming interface (APIs) for data science and high-performance computing as well as system on a chip units (SoCs) for the mobile computing and automotive market. Nvidia is a dominant supplier of artificial intelligence hardware and software. Its professional line of GPUs are used in workstations for applications in such fields as:
-
Architecture.
-
Engineering.
-
Construction.
-
Media & Entertainment.
-
Automotive.
-
Scientific Research.
-
Manufacturing Design.
Specifically Nvidia Stock has ended the first leg of its Grand Super Cycle back on 11.22.2022 following by an expected pullback. For each cycle or grand super cycle there is an end. A pullback needs to take place before any possible further continuation higher.
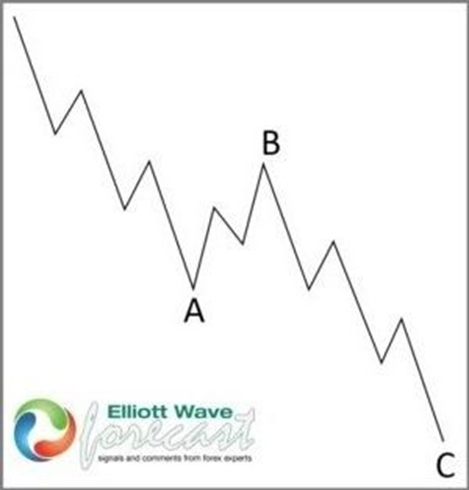
In NVDA we can see that it ended the Grand Super Cycle in wave ((I)) at 346.41 from the all time lows since it has been listed in the stock exchange in 1999. The pullback came in the form of a simple Zig Zag (5-3-5). The Guidelines in Elliott Wave for the Zig Zag suggests that is a corrective 3 waves structure labelled as ABC with a subdivision of wave A and C is 5 waves, either impulse or diagonal. And wave B can be any corrective structure. Here’s how ti looks:
Elliott Wave zig zag (5-3-5)
Let’s have a look now at NVDA weekly chart and analyze the move alongside what could be happening next.
NVDA weekly weekend update 04.02.2023
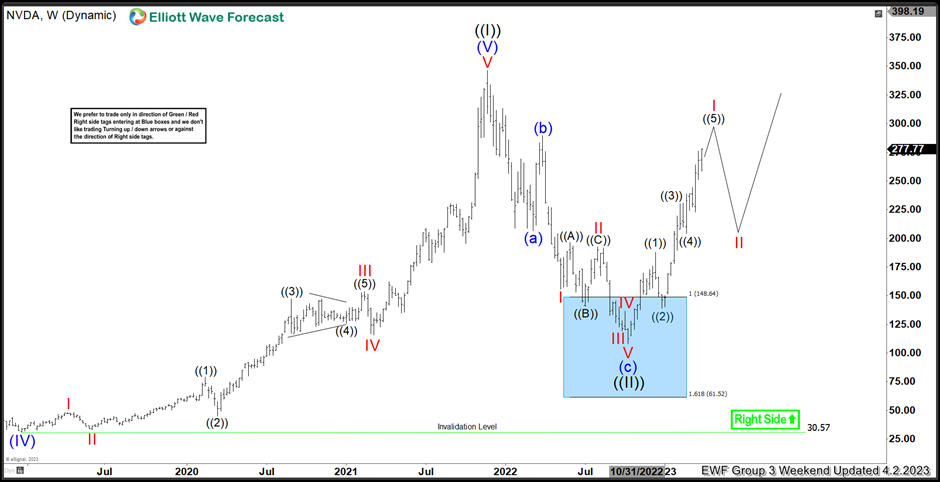
Once we have ended the connector (b) wave within ((II)) we where able to present to our members the weekly blue box area. Between $148.64 – $61.52 area we were expecting it to end V of (c) and consequently ((II)). Since the low from October 2022 at $108.21 the instrument shows 5 waves. Having said that it favors that soon should be ending wave I and a pullback in II should be taking place.
Overall, the stock should see further upside longer term and the wave ((III)) within the grand super cycle may lead to much higher prices than 2022. Members of Elliott Wave Forecast that bough the stock within the blue box area are now risk free. The area may have provided a generational buying opportunity for the next couple of years.
You can learn what are the levels Nvidia stock is heading towards and how we see the bigger picture by joining us at Elliott Wave Forecast. Learn how to trade or invest instruments at blue boxes and find potential long term trading ideas.
Consider to become a member and improve your trading/investing decisions. Alongside with daily Live Analysis Sessions and Live Trading Room. On top of that we have a 24 hour live chat and chat room in which we answer any questions for each instrument. Click the links below to sign up or try first our 14 day trial.
Author

Elliott Wave Forecast Team
ElliottWave-Forecast.com


