|

NVDA reacting higher after ending A-B-C correction

In this technical blog, we will look at the past performance of the 4-hour Elliott Wave Charts of NVDA. We presented to members at the elliottwave-forecast. In which, the rally from 03 January 2024 low unfolded as an impulse structure and showed a higher high sequence favored more upside to take place. Therefore, we advised members not to sell the stock & buy the dips in 3, 7, or 11 swings at the blue box areas. We will explain the structure & forecast below:

NVDDA four-hour Elliott Wave chart from 4.04.2024

Chart

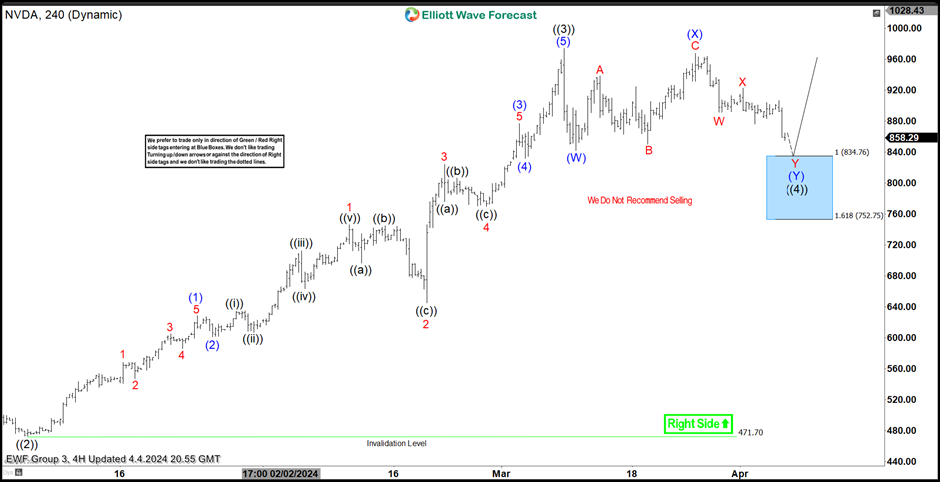
Here’s the 4hr Elliott wave chart from the 9/20/2023 update. In which, the cycle from the 1/03/2024 low ended in wave ((3)) as an impulse structure at $974 high. Down from there, the stock made a pullback in wave ((4)) to correct that cycle. The internals of that pullback unfolded as Elliott wave double three structure where wave (W) ended at $841.66 low. Wave (X) bounce ended at $967.66 high and wave (Y) managed to reach the blue box area at $834.76- $752.75. From there, buyers were expected to appear looking for the next leg higher or for a 3 wave bounce minimum.

NVDA latest four-hour Elliott Wave chart from 4.15.2024

Chart

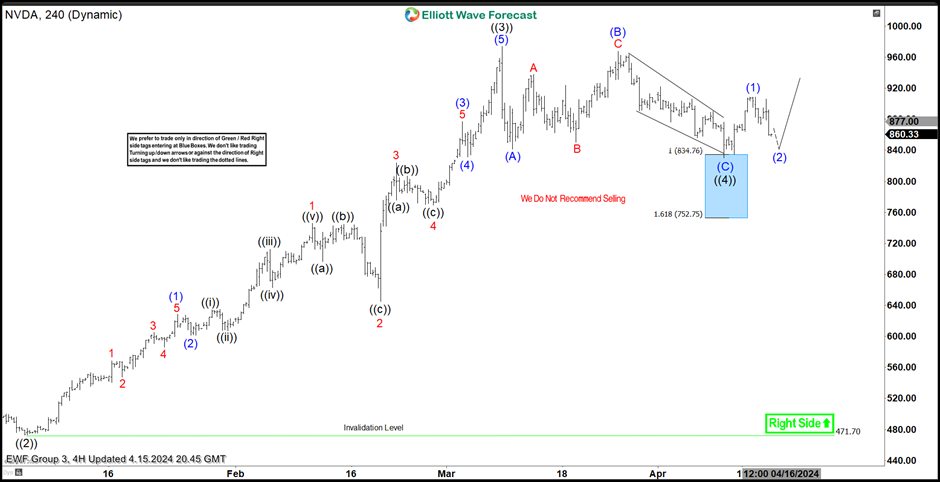
This is the latest 4hr Elliott wave Chart from the 4/15/2024 update. In which the stock is showing a reaction higher taking place, right after ending the correction within the blue box area. Allowed members to create a risk-free position shortly after taking the long position at the blue box area. However, a break above $974 high is still needed to confirm the next extension higher & avoid a double correction lower.

Author

Elliott Wave Forecast Team

Elliott Wave Forecast Team

ElliottWave-Forecast.com

More from Elliott Wave Forecast Team
Share:

Editor's Picks

EUR/USD climbs to two-week highs beyond 1.1900

EUR/USD is keeping its foot on the gas at the start of the week, reclaiming the 1.1900 barrier and above on Monday. The US Dollar remains on the back foot, with traders reluctant to step in ahead of Wednesday’s key January jobs report, allowing the pair to extend its upward grind for now.

GBP/USD hits three-day peaks, targets 1.3700

GBP/USD is clocking decent gains at the start of the week, advancing to three-day highs near 1.3670 and building on Friday’s solid performance. The better tone in the British Pound comes on the back of the intense sekk-off in the Greenback and despite re-emerging signs of a fresh government crisis in the UK.

Gold treads water around $5,000

Gold is trading in an inconclusive fashion around the key $5,000 mark on Monday week. Support is coming from fresh signs of further buying from the PBoC, while expectations that the Fed could turn more dovish, alongside concerns over its independence, keep the demand for the precious metal running.

Crypto Today: Bitcoin steadies around $70,000, Ethereum and XRP remain under pressure 

Bitcoin hovers around $70,000, up near 15% from last week's low of $60,000 despite low retail demand. Ethereum delicately holds $2,000 support as weak technicals weigh amid declining futures Open Interest. XRP seeks support above $1.40 after facing rejection at $1.54 during the previous week's sharp rebound.

Japanese PM Takaichi nabs unprecedented victory – US data eyed this week

I do not think I would be exaggerating to say that Japanese Prime Minister Sanae Takaichi’s snap general election gamble paid off over the weekend – and then some. This secured the Liberal Democratic Party (LDP) an unprecedented mandate just three months into her tenure.

Ripple exposed to volatility amid low retail interest, modest fund inflows

Ripple (XRP) is extending its intraday decline to around $1.40 at the time of writing on Monday amid growing pressure from the retail market and risk-off sentiment that continues to keep investors on the sidelines.