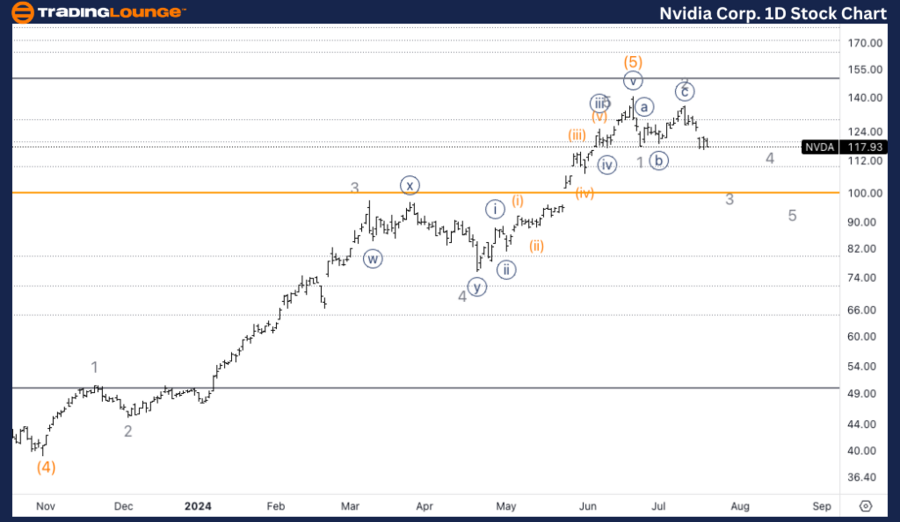
NVDA Elliott Wave Analysis Trading Lounge Daily Chart,
NVIDIA Corp., (NVDA) Daily Chart.
NVDA Elliott Wave technical analysis
Function: Counter Trend.
Mode: Corrective.
Structure: ZigZag.
Position: Intermediate wave (A).
Direction: Downside in wave 3.
Details: We are looking at either a significant top in place in wave (5), or else we could be continuing higher, after a clear three wave move to the downside, leaving us with one more leg lower to come before upside resumption.
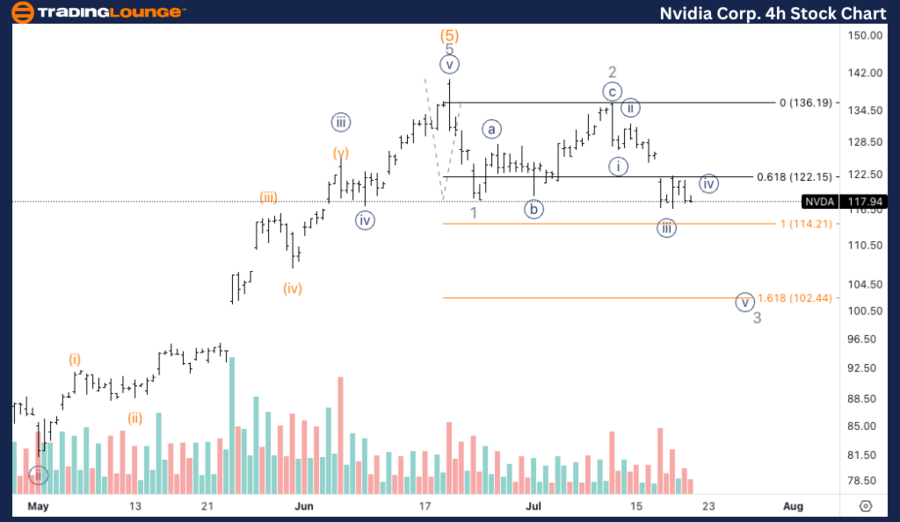
NVDA Elliott Wave Analysis Trading Lounge 4H Chart,
NVIDIA Corp., (NVDA) 4H Chart.
NVDA Elliott Wave technical analysis
Function: Counter Trend.
Mode: Corrective.
Structure: ZigZag.
Position: Wave 3 of (A).
Direction: Downside in wave 3.
Details: We can see what appears to be a five wave move into wave 3. Common wave 3 targets stands at 102$ with 1.618 wave 3 vs. 1 which seems to be confirmed by volume.
Welcome to our latest Elliott Wave analysis for NVIDIA Corp. (NVDA). This analysis provides an in-depth look at NVIDIA's price movements using the Elliott Wave Theory, helping traders identify potential opportunities based on current trends and market structure. We will cover insights from both the daily and 4-hour charts to offer a comprehensive perspective on NVIDIA's market behavior.
NVDA Elliott Wave technical analysis – Daily chart
The daily chart indicates that NVDA has either reached a significant top in wave (5) or is poised to continue higher following a corrective phase. The recent price action shows a clear three-wave move to the downside, suggesting that one more leg lower is likely before any potential upside resumption. Traders should monitor for signs of the completion of wave 3 within this corrective phase.
NVDA Elliott Wave technical analysis – Four-hour chart
The 4-hour chart shows a five-wave move into wave 3, indicating a strong downward impulse. Common targets for wave 3 are around $102, supported by the 1.618 extension of wave 3 versus wave 1.
Technical analyst: Alessio Barretta.
NVDA Elliott Wave technical analysis [Video]
As with any investment opportunity there is a risk of making losses on investments that Trading Lounge expresses opinions on.
Historical results are no guarantee of future returns. Some investments are inherently riskier than others. At worst, you could lose your entire investment. TradingLounge™ uses a range of technical analysis tools, software and basic fundamental analysis as well as economic forecasts aimed at minimizing the potential for loss.
The advice we provide through our TradingLounge™ websites and our TradingLounge™ Membership has been prepared without considering your objectives, financial situation or needs. Reliance on such advice, information or data is at your own risk. The decision to trade and the method of trading is for you alone to decide. This information is of a general nature only, so you should, before acting upon any of the information or advice provided by us, consider the appropriateness of the advice considering your own objectives, financial situation or needs. Therefore, you should consult your financial advisor or accountant to determine whether trading in securities and derivatives products is appropriate for you considering your financial circumstances.
Recommended content
Editors’ Picks
EUR/USD holds gains near 1.0900 amid weaker US Dollar
![EUR/USD holds gains near 1.0900 amid weaker US Dollar](https://editorial.fxstreet.com/images/Markets/Currencies/Majors/EURUSD/MoneyEURUSD_3_XtraSmall.jpg)
EUR/USD defends gains below 1.0900 in the European session on Monday. The US Dollar weakens, as risk sentiment improves, supporting the pair. The focus remains on the US political updates and mid-tier US data for fresh trading impetus.
GBP/USD trades sideways above 1.2900 despite risk recovery
![GBP/USD trades sideways above 1.2900 despite risk recovery](https://editorial.fxstreet.com/images/Markets/Currencies/Majors/GBPUSD/british-banknotes-14144912_XtraSmall.jpg)
GBP/USD is keeping its range play intact above 1.2900 in the European session on Monday. The pair fails to take advantage of the recovery in risk sentiment and broad US Dollar weakness, as traders stay cautious ahead of key US event risks later this week.
Gold price remains on edge on firm prospects of Trump’s victory
![Gold price remains on edge on firm prospects of Trump’s victory](https://editorial.fxstreet.com/images/Markets/Commodities/Metals/Gold/stacks-of-gold-bars-19033163_XtraSmall.jpg)
Gold price exhibits uncertainty near key support of $2,400 in Monday’s European session. The precious metal remains on tenterhooks amid growing speculation that Donald Trump-led-Republicans will win the US presidential elections in November.
Solana could cross $200 if these three conditions are met
![Solana could cross $200 if these three conditions are met](https://editorial.fxstreet.com/images/Markets/Currencies/Cryptocurrencies/Solana/solana_XtraSmall.jpg)
Solana corrects lower at around $180 and halts its rally towards the psychologically important $200 level early on Monday. The Ethereum competitor has noted a consistent increase in the number of active and new addresses in its network throughout July.
Election volatility and tech earnings take centre stage
![Election volatility and tech earnings take centre stage](https://editorial.fxstreet.com/images/TechnicalAnalysis/Volatility/Bands%20(bollinger)/stock-market-graph-gm532464153-55981218_XtraSmall.jpg)
The US Dollar managed to end the week higher as Trump Trades ensued. Safe-havens CHF and JPY were also higher while activity currencies such as NOK and NZD underperformed.