Northern Star Resources Ltd (NST) analysis and Elliott Wave forecast [Video]
![Northern Star Resources Ltd (NST) analysis and Elliott Wave forecast [Video]](https://editorial.fxstreet.com/images/i/bullish-line_XtraLarge.png)
NST Elliott Wave technical analysis
Today's Elliott Wave analysis provides an update on the Australian Stock Exchange (ASX) with a focus on NORTHERN STAR RESOURCES LTD (NST).
We identify upside potential in ASX:NST, though we anticipate a pullback with the ((ii))-navy wave first. Additional time may be required before wave ((iii))-navy moves higher. This analysis includes key visual price points to help readers determine when the trend is shifting or when the structure becomes invalidated.
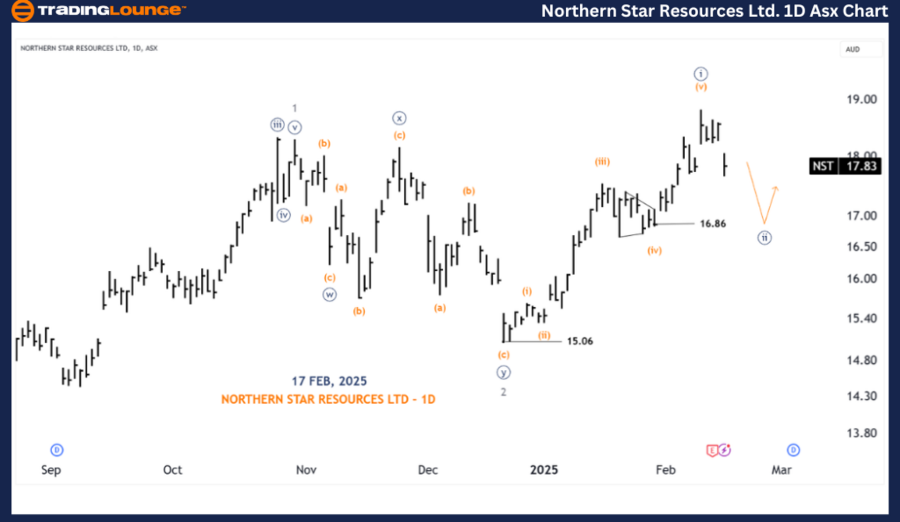
ASX: NST Elliott Wave technical analysis – One-day chart (semilog scale)
-
Function: Major trend (Intermediate degree, orange).
-
Mode: Motive.
-
Structure: Impulse.
-
Position: Wave ((ii))-navy.
Details:
-
Wave ((i))-navy appears to have recently completed a five-wave formation.
-
Wave ((ii))-navy may now be developing downward, targeting the 16.86 support level.
-
Once completed, wave ((iii))-navy is expected to resume an upward trend.
-
Invalidation point: 15.06
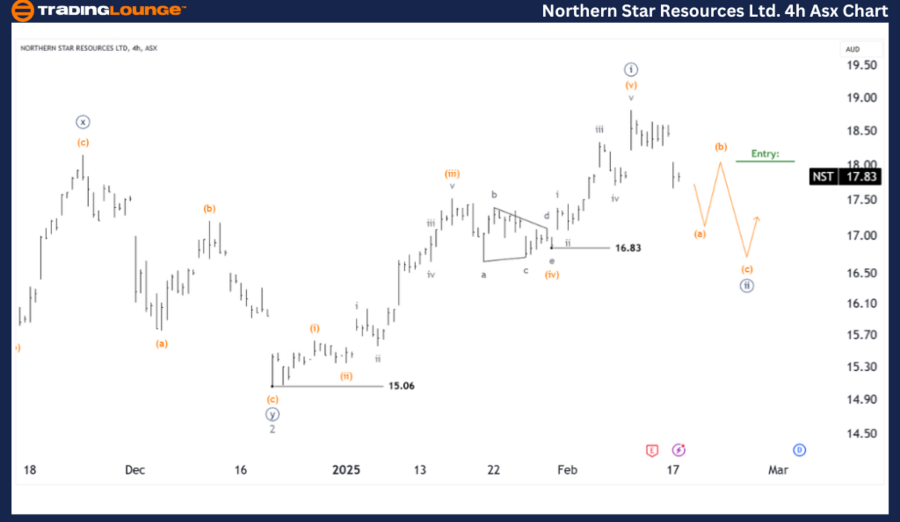
ASX: NST Elliott Wave technical analysis – Four-hour chart
-
Function: Major trend (Minute degree, navy).
-
Mode: Motive.
-
Structure: Impulse.
-
Position: Wave (a)-orange of Wave ((ii))-navy.
Details:
-
Wave ((ii))-navy has yet to reach its target of 16.83, suggesting further downside movement.
-
The structure may continue to decline in an ABC formation before reversing.
-
A strategic entry point may be at the completion of wave (b)-orange, providing an opportunity for a quality long trade.
-
Invalidation point: 15.06.
-
Key Point: The completion of Wave (b)-orange.
Conclusion
This analysis of ASX: NORTHERN STAR RESOURCES LTD (NST) provides insights into current market trends and strategies to capitalize on them. By identifying key price levels that confirm or invalidate our wave count, we enhance the accuracy of our forecast. Our approach delivers an objective and professional outlook, enabling traders to make well-informed decisions.
Northern Star Resources Ltd (NST) analysis and Elliott Wave forecast [Video]
Author

Peter Mathers
TradingLounge
Peter Mathers started actively trading in 1982. He began his career at Hoei and Shoin, a Japanese futures trading company.


