- NIO stock ends Wednesday higher to put in a three-day win streak.
- NIO added another 1.2% on Wednesday to hit $22.17.
- The Chinese EV stock remains a big loser year to date, down 30%.
Nio stock (NIO) edged higher on Friday despite some other retail interest stocks starting to reverse recent momentum gains. NIO has now gained for three straight sessions, although most gains are modest. By comparison, other retail interest stocks have exhibited their customary volatility with the likes of AMC and GME spiking before a collapse on Wednesday. NIO looks calm by comparison but remains well down on the year so far as high growth stocks and especially Chinese high-growth stocks fell out of investor favor.
Nio Stock News: Entering the phone business
NIO has been the subject of rumours for some time that it is preparing to enter the phone-making industry, and now a report from China's CNEVPost says this may be in the cards. NIO CEO William Li spoke on a talk show that this may be a possibility.
"We will look at this direction positively and are aware that getting the phone produced is easy, but building a good phone is challenging," Li said.
This is interesting but not significant from an earnings perspective any time soon in our view. In the same interview, the CEO also said Apple (AAPL) is the main competitor to look out for if they enter the car space. Recent news flow surrounding the Apple car project has not been positive, and it looks for now like the company is focusing on its core phone and tablet businesses.
Overnight news from Asia does not make for positive reading with Chinese shares under pressure across the board. China's manufacturing data for March was not good as the country battles with a covid surge. Numerous cities have been locked down or partially locked down. NIO is down 1% in Hong Kong.
Nio Stock Forecast: Inverted hammer at mid-swing
The move on Wednesday, while positive, does leave a bitter aftertaste. We have an inverted hammer candle. A long spike with the body much lower in the daily range. This is a reversal signal. NIO spiked higher but could not sustain the move and closed much lower than the intraday high. This is consistent with what is happening with other retail stocks. AMC and GME fell sharply on Wednesday.
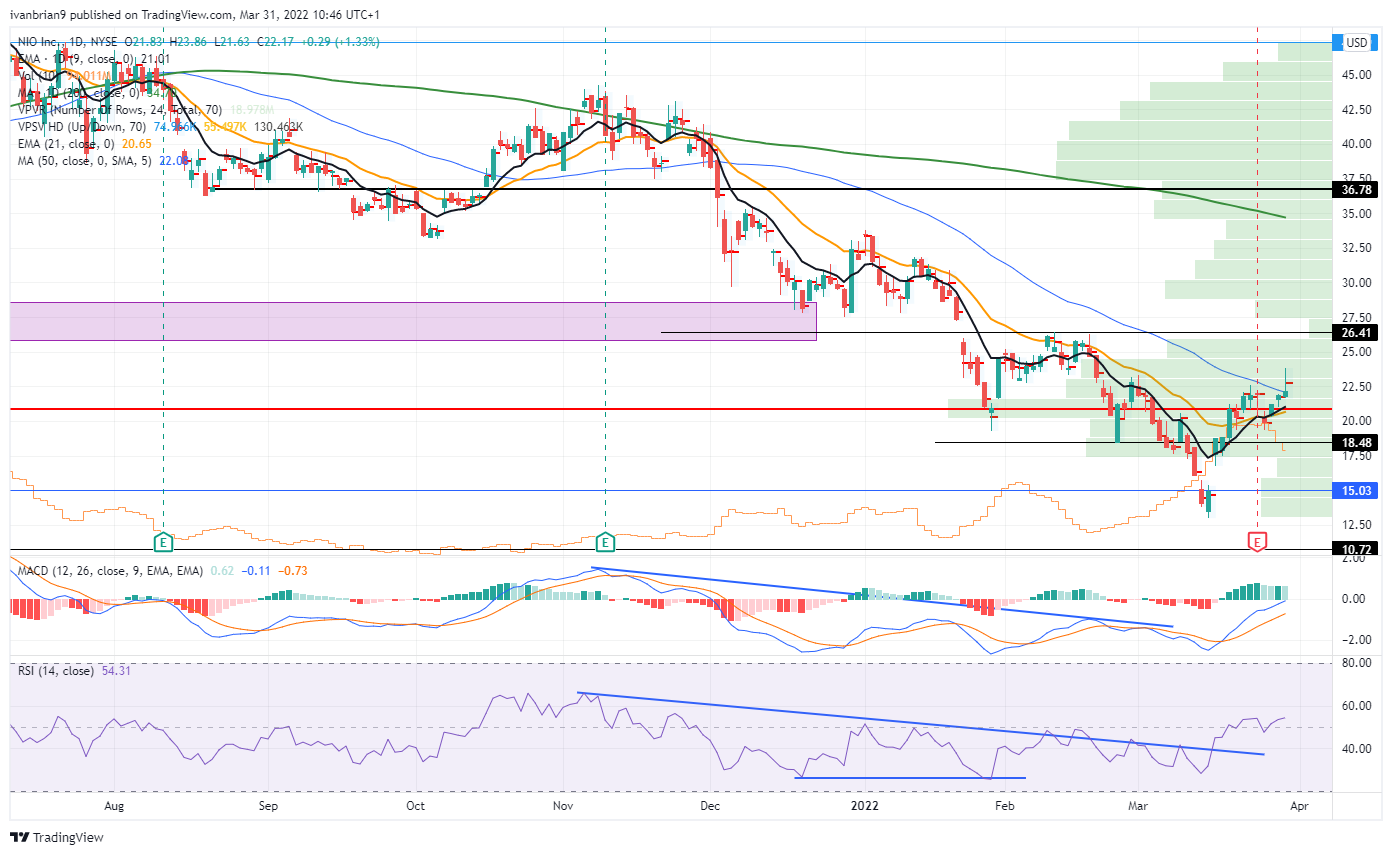
NIO stock chart, daily
The 15-minute chart below shows this in more detail. $22 is short-term support from the volume profile, and breaking below $21 sees a volume gap to $19.50.
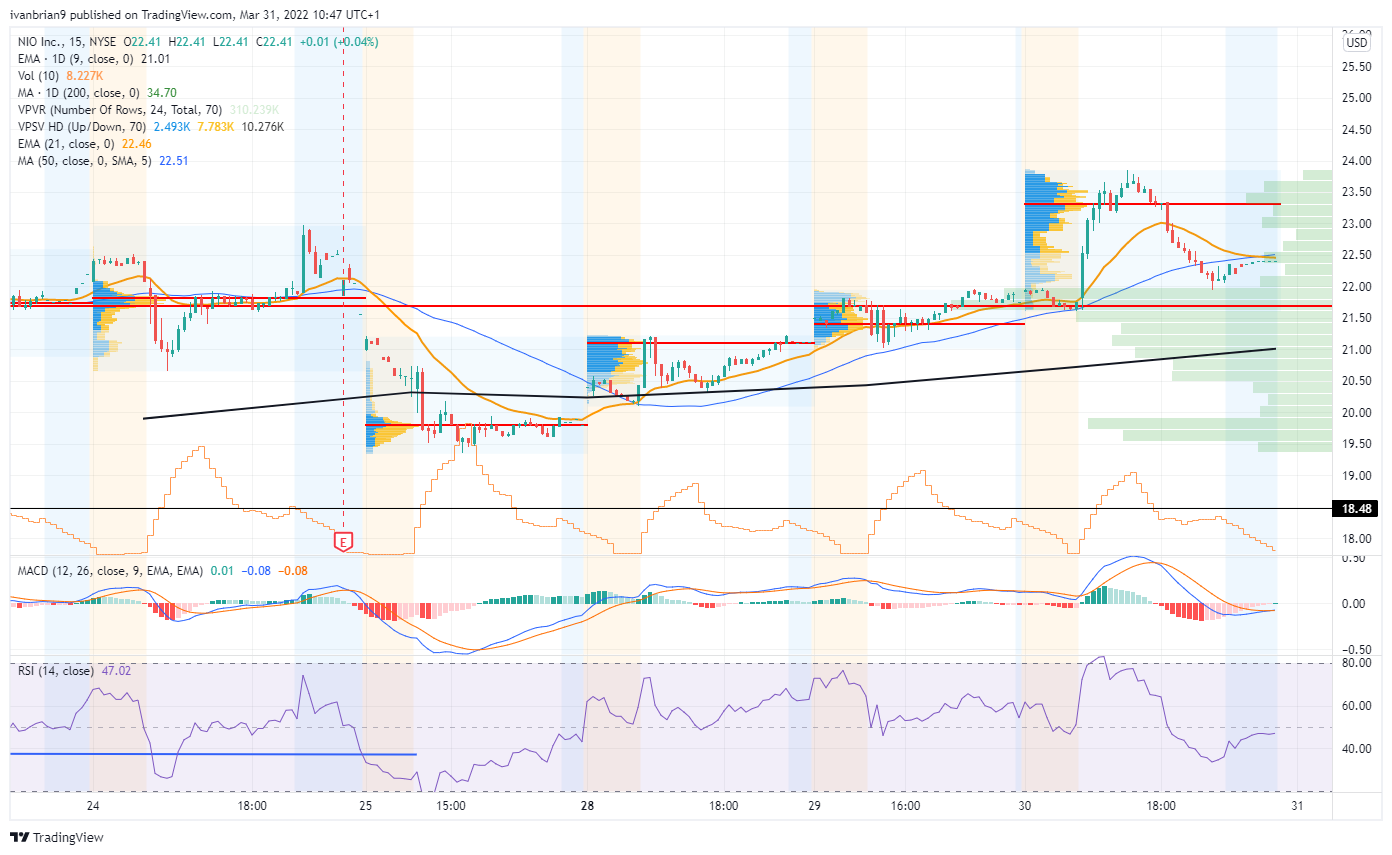
NIO stock chart, 15-minute
Information on these pages contains forward-looking statements that involve risks and uncertainties. Markets and instruments profiled on this page are for informational purposes only and should not in any way come across as a recommendation to buy or sell in these assets. You should do your own thorough research before making any investment decisions. FXStreet does not in any way guarantee that this information is free from mistakes, errors, or material misstatements. It also does not guarantee that this information is of a timely nature. Investing in Open Markets involves a great deal of risk, including the loss of all or a portion of your investment, as well as emotional distress. All risks, losses and costs associated with investing, including total loss of principal, are your responsibility. The views and opinions expressed in this article are those of the authors and do not necessarily reflect the official policy or position of FXStreet nor its advertisers. The author will not be held responsible for information that is found at the end of links posted on this page.
If not otherwise explicitly mentioned in the body of the article, at the time of writing, the author has no position in any stock mentioned in this article and no business relationship with any company mentioned. The author has not received compensation for writing this article, other than from FXStreet.
FXStreet and the author do not provide personalized recommendations. The author makes no representations as to the accuracy, completeness, or suitability of this information. FXStreet and the author will not be liable for any errors, omissions or any losses, injuries or damages arising from this information and its display or use. Errors and omissions excepted.
The author and FXStreet are not registered investment advisors and nothing in this article is intended to be investment advice.
Recommended content
Editors’ Picks
AUD/USD: There is a solid support around 0.6300
The selling bias in AUD/USD remained unabated for the fourth day in a row on Wednesday, with spot putting the key 0.6300 contention zone to the test amid a recovery in the US Dollar and tariffs concerns.
EUR/USD: The inability to surpass 1.0500 could spark a deeper correction
EUR/USD reversed two consecutive daily advances, closing below the 1.0500 barrier following another unsuccessful attempt to challenge the YTD peaks near 1.0530 amid a decent bounce in the Greenback.
Gold finding buyers on intraday dips
As the US Dollar continues to lose momentum, Gold prices have reversed their initial dip and reclaimed the key $2,900 per troy ounce mark—and beyond—while investors gear up for President Trump’s upcoming speech.
Top 3 buy zones for Bitcoin as buy signal flashes on BTC price chart
Bitcoin (BTC) hovers around the $87,000 level on Wednesday after traders faced massive liquidations following the largest cryptocurrency’s crash under the $90,000 support level.
February inflation: Sharp drop expected in France, stability in the rest of the Eurozone
Inflation has probably eased in February, particularly in France due to the marked cut in the regulated electricity price. However, this overall movement masks divergent trends. Although disinflation is becoming more widespread, prices continue to rise rapidly in services, in France as well as elsewhere in the Eurozone.
The Best brokers to trade EUR/USD
SPONSORED Discover the top brokers for trading EUR/USD in 2025. Our list features brokers with competitive spreads, fast execution, and powerful platforms. Whether you're a beginner or an expert, find the right partner to navigate the dynamic Forex market.