- NIO shares outperforming sector leader Tesla.
- NIO still needs to break above moving average resistance.
- The EV maker shows a triangle formation, awaits a breakout for further direction.
Update April 22: Nio Inc (NYSE: NIO) surged by 5.3% on Wednesday, closing at $38.90 as the world prepares for Earth Day. Shares of the Chinese electric vehicle maker have been benefiting from the rising awareness of green technologies and also as global stock markets recover. Investors are focused on America's quick growth and for now are shrugging off rising coronavirus cases in India and other Asian countries.
NIO has been a retail favourite in 2021 with the shares driven to $66.99 in mid-January but has slipped substantially since as investor enthusiasm for the EV sector has waned. Tesla, the sector leader, has been under pressure, and this has spread to the rest of the EV stocks. Not helping the case has been mainstream auto companies announcing plans to move into the EV space.
Stay up to speed with hot stocks' news!
NIO is a Chinese electric vehicle manufacturer designing, manufacturing and selling smart EVs. NIO is also involved in the autonomous driving sector.
NIO price prediction
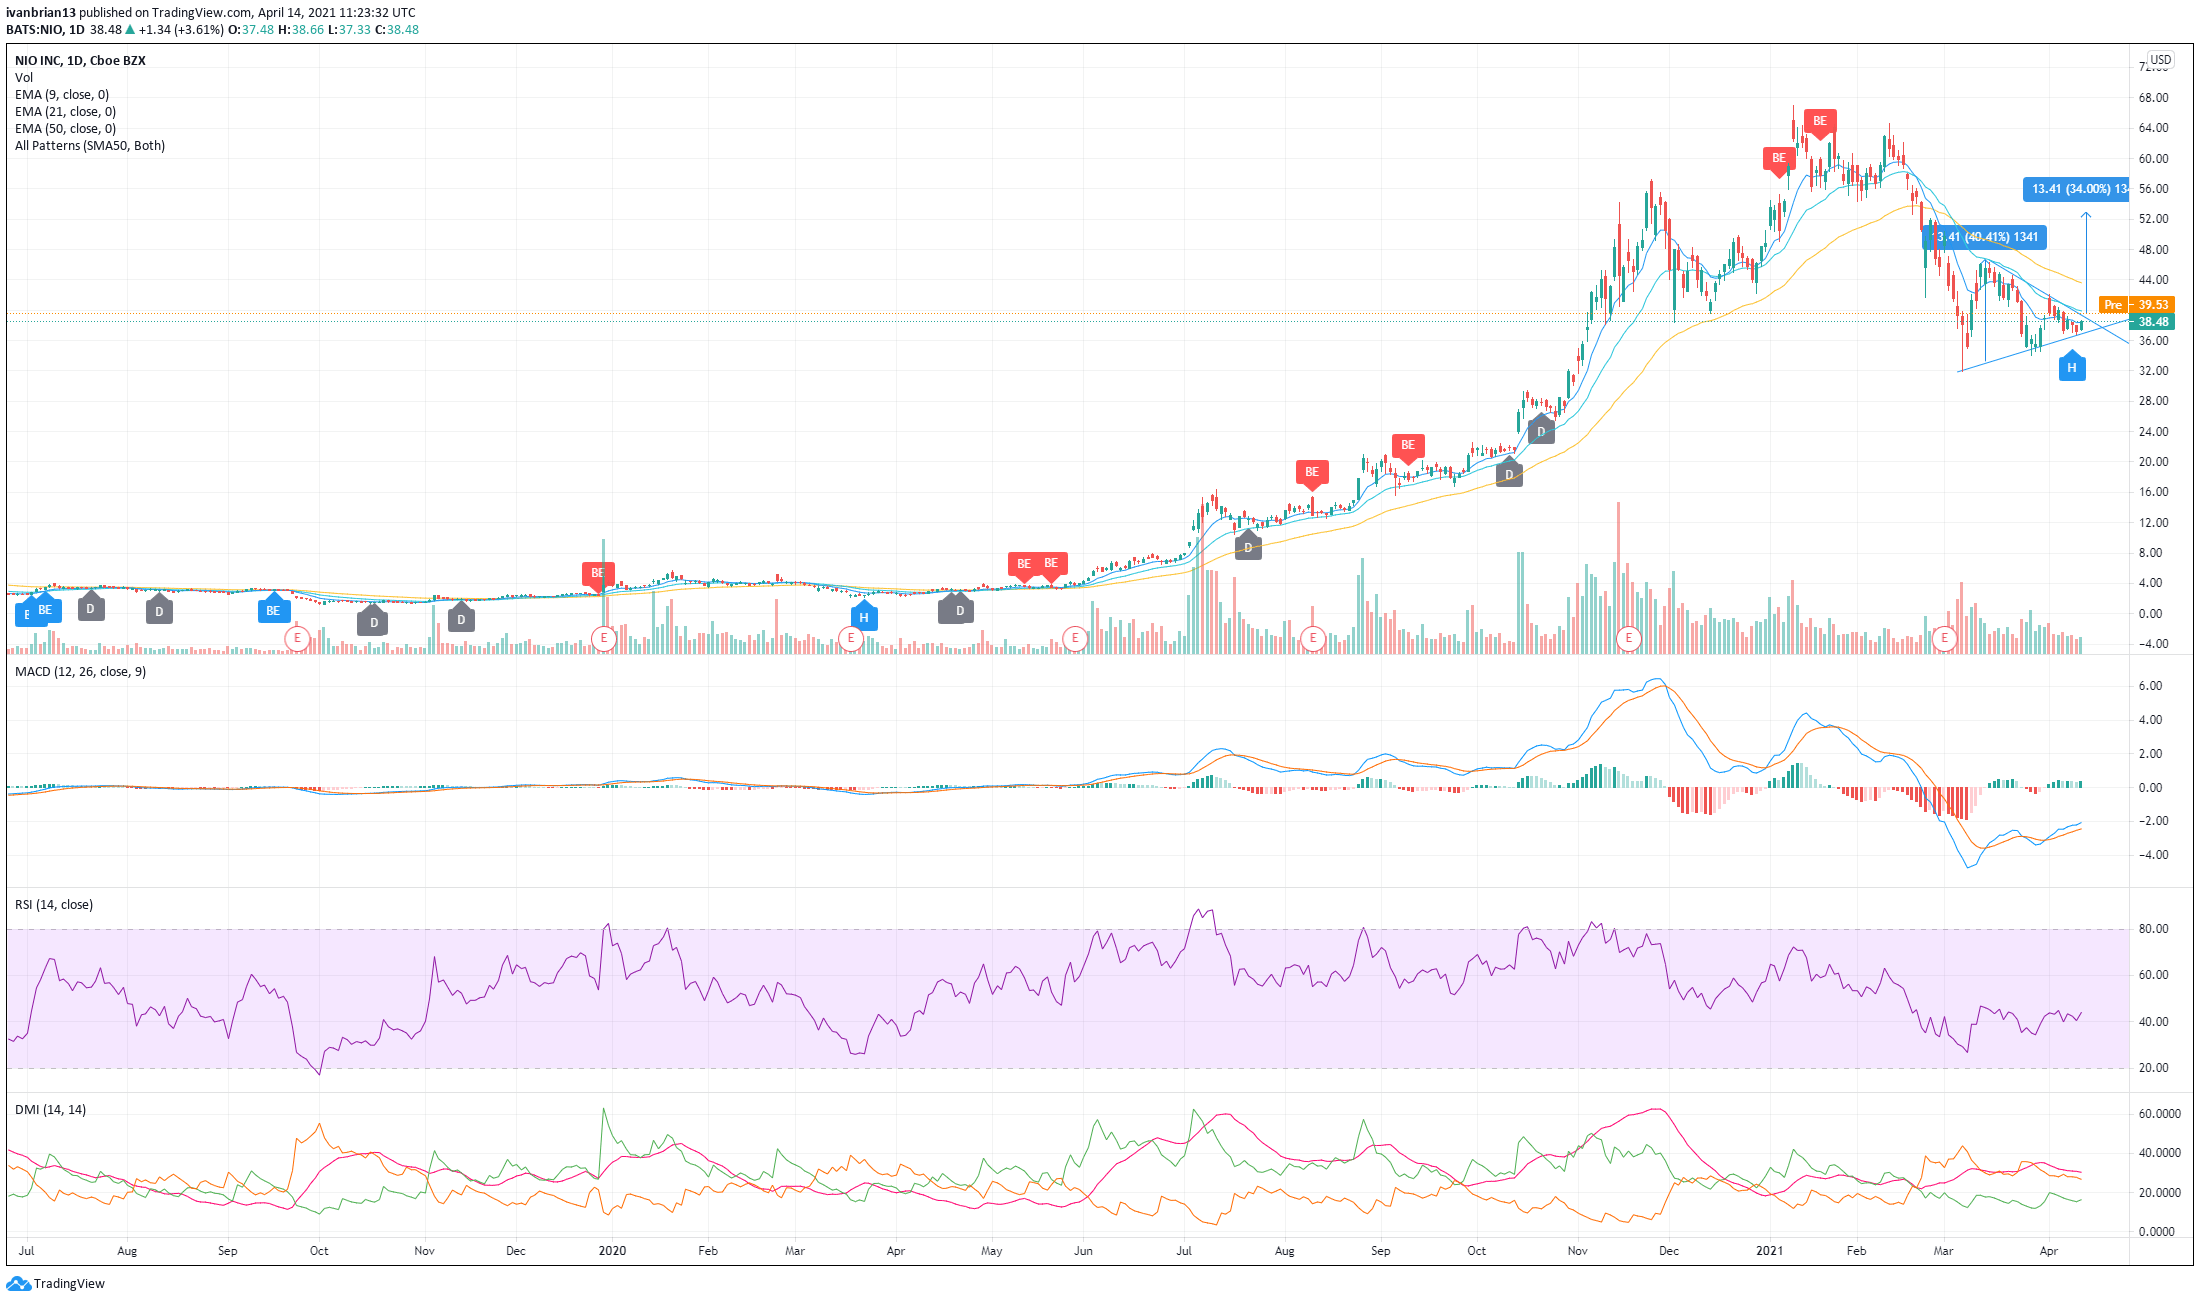
Looking at the big picture, all is not great for NIO. We can clearly see the big fall over the last few months. This may be understandable as NIO is still comfortably higher than this time last year. In April 2020, NIO was trading around $3!
Currently, we have a classic bearish series of lower lows and lower highs. Normally, it is not advised to go against this, but there is some reason to consider a bullish position.
The Moving Average Convergence Divergence (MACD) oscillator has crossed over, giving a buy signal on March 31. MACD signals can be a bit difficult to trade as they are often late and backward-looking, but in NIO's case, the MACD is also confirming the price trend with a higher low. Divergences are stronger signals for the MACD but the combination of the crossover and confirming uptrend in both price and MACD help the bullish argument. We can see from the chart the upward sloping trend line showing the higher lows made by NIO on March 26 versus March 5.
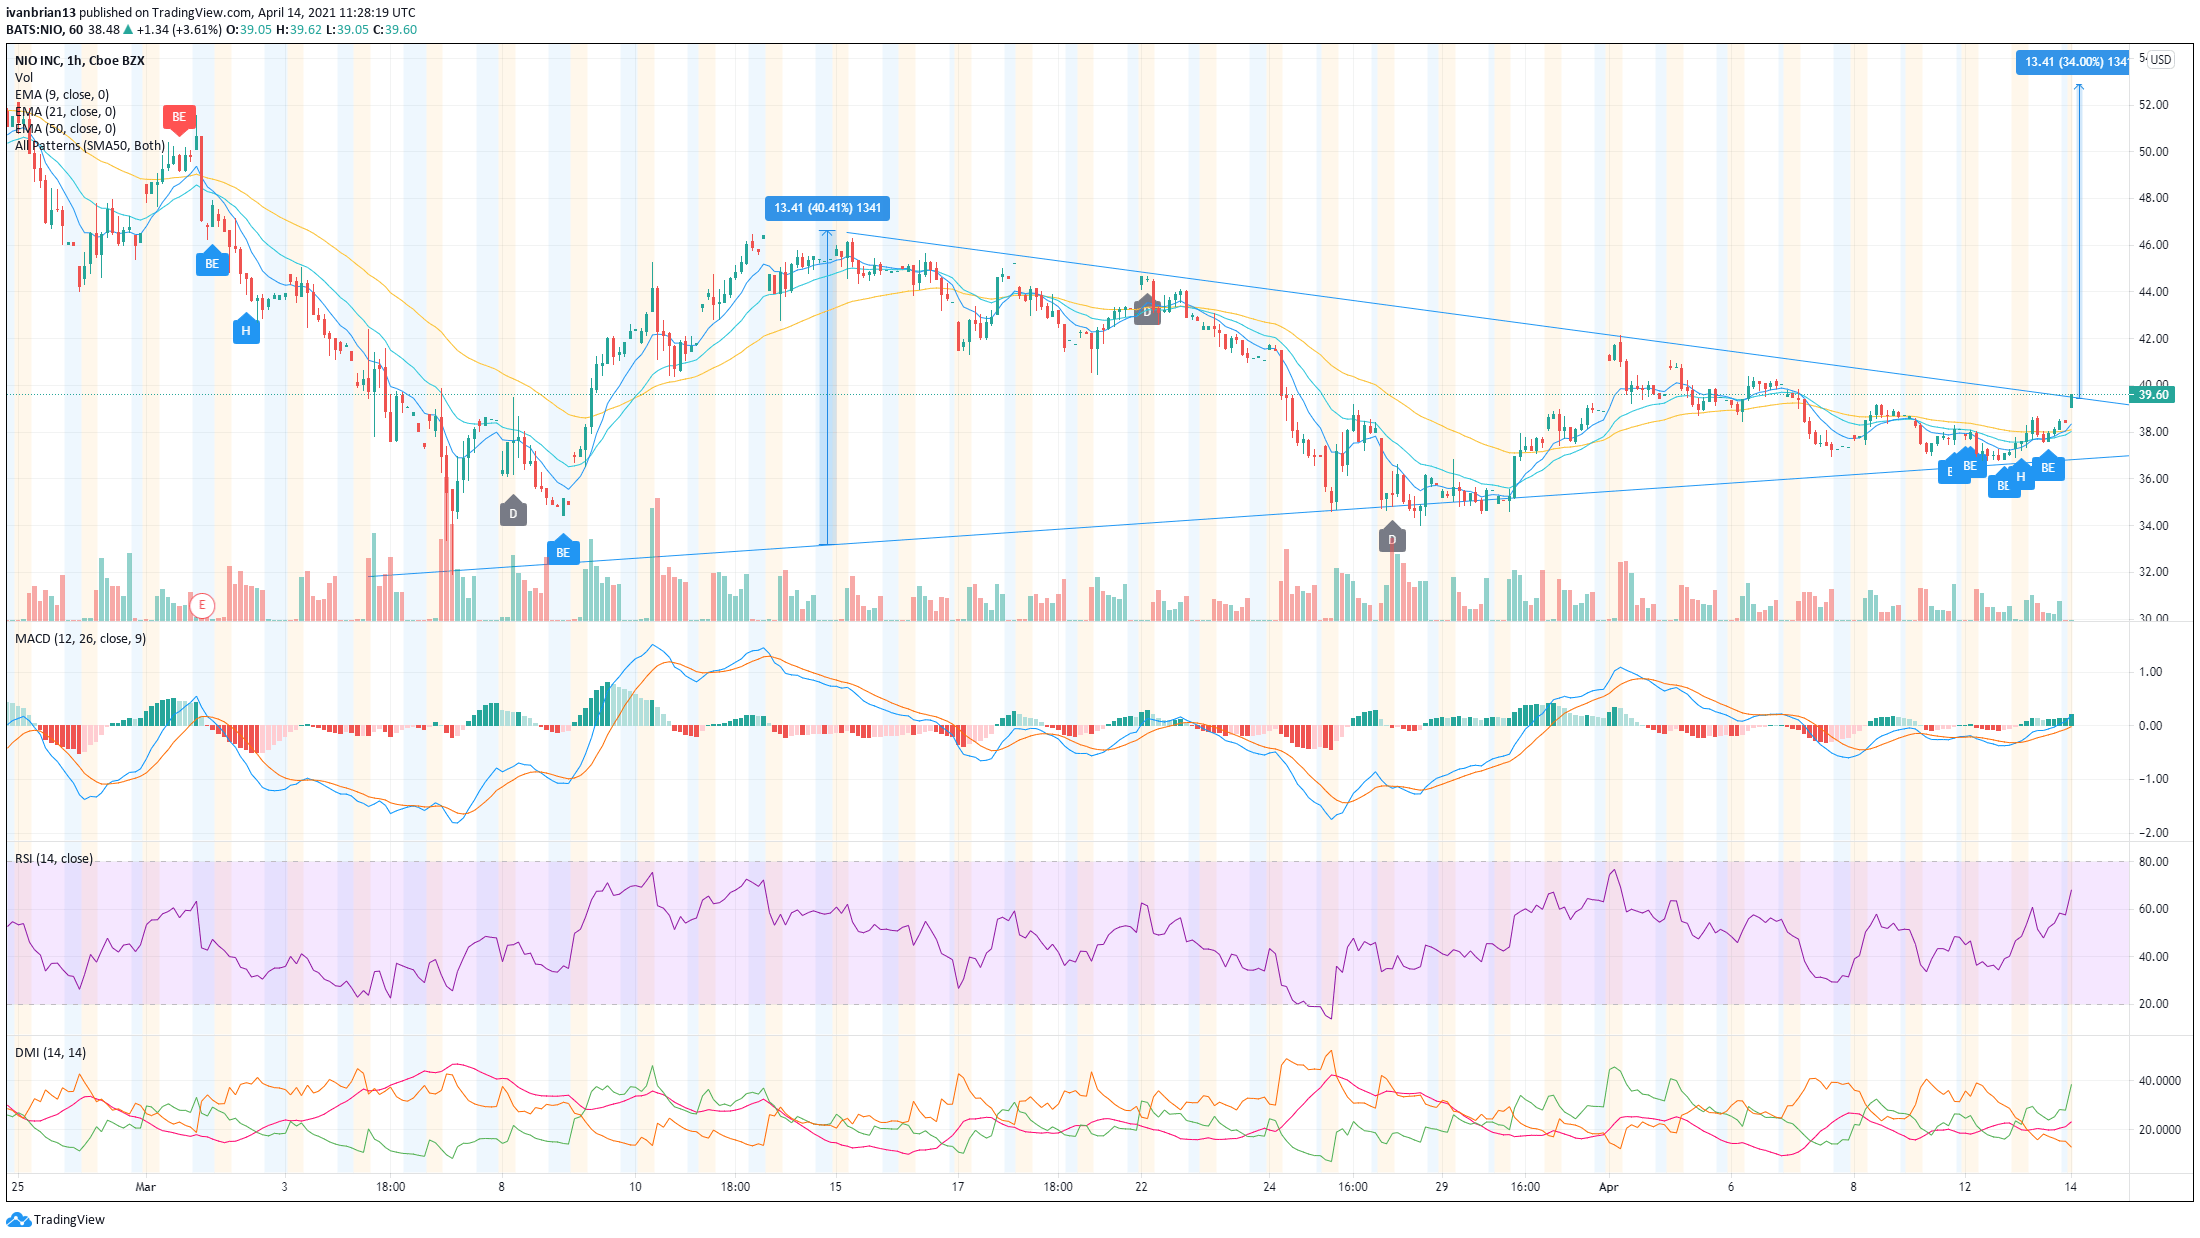
The last few session have seen NIO remain in the ever-tightening triangle range. A tightening of the range and a triangle will always eventually lead to a breakout. trading breakouts can be quite profitable if on the right side as the price moves can accelerate rapidly. The target is the size of the entry of the triangle. In the case of NIO, the entry was a $13.41 price range so the target on a breakout will be circa $13 dollars higher.
Further clues to bullishness show in the Directional Movement Index (DMI). This indicator is used to show the strength of a trend and also gives buy and sell signals on crossovers. The DMI peaked in December, and despite NIO shares price rising the DMI did not make a matching high. This divergence was a bearish signal and NIO duly dropped sharply.
RSI remains steady and is not showing oversold or overbought conditions. Candlestick formations are giving some indecision with a hammer candle on April 9. Hammer candles can confirm a downtrend or signal a reversal.
In order to confirm the bullish potential NIO needs to recapture the 9 and 21-day moving averages. This is preferable before taking a long position. Recapturing would also likely see the breakout of the triangle formation adding to the measure of safety.
On the hourly chart, the green DMI line has crossed the red, giving a bullish signal. RSI is again in neutral territory and MACD remains crossed into bullish territory. Also, the hourly chart shows a number of bullish engulfing candle formations.
Go long on a break of the 9 and 21 day moving averages with a stop just below is the trade offering more risk-reward from a technical perspective.
Previous updates
Update April 20: Nio Inc (NYSE: NIO) is set to extend its gains and rise above $37, nearly another 1%, on Tuesday, according to after-hours data. That would come on top of Monday's 1.9% increase to $36.78 and comes as smaller electric vehicle makers benefit from Tesla's troubles. A car with nobody in the driver's seat suffered a crash in Texas. While Tesla's founder Elon Musk said that the automobile did not have autonomous driving installed, the ongoing issue weighs on Tesla and allows competitors to shine.
Update, April 16: NIO Inc. (NYSE: NIO) recovered from two-week lows of $34.56 and jumped back above the $35.50 barrier into Wednesday’s close. Despite the pullback from lower levels, the stock finished the day nearly 3.5% lower. The traders remain bullish on the stock, even though the price is down 50% from the all-time-highs of $66.99, as the risk-reversals – a gauge of calls to puts – remain in the favor of the bulls. The record rally on the Wall Street indices helped cushion the downside. However, the short-term technical picture may not appear very constructive.
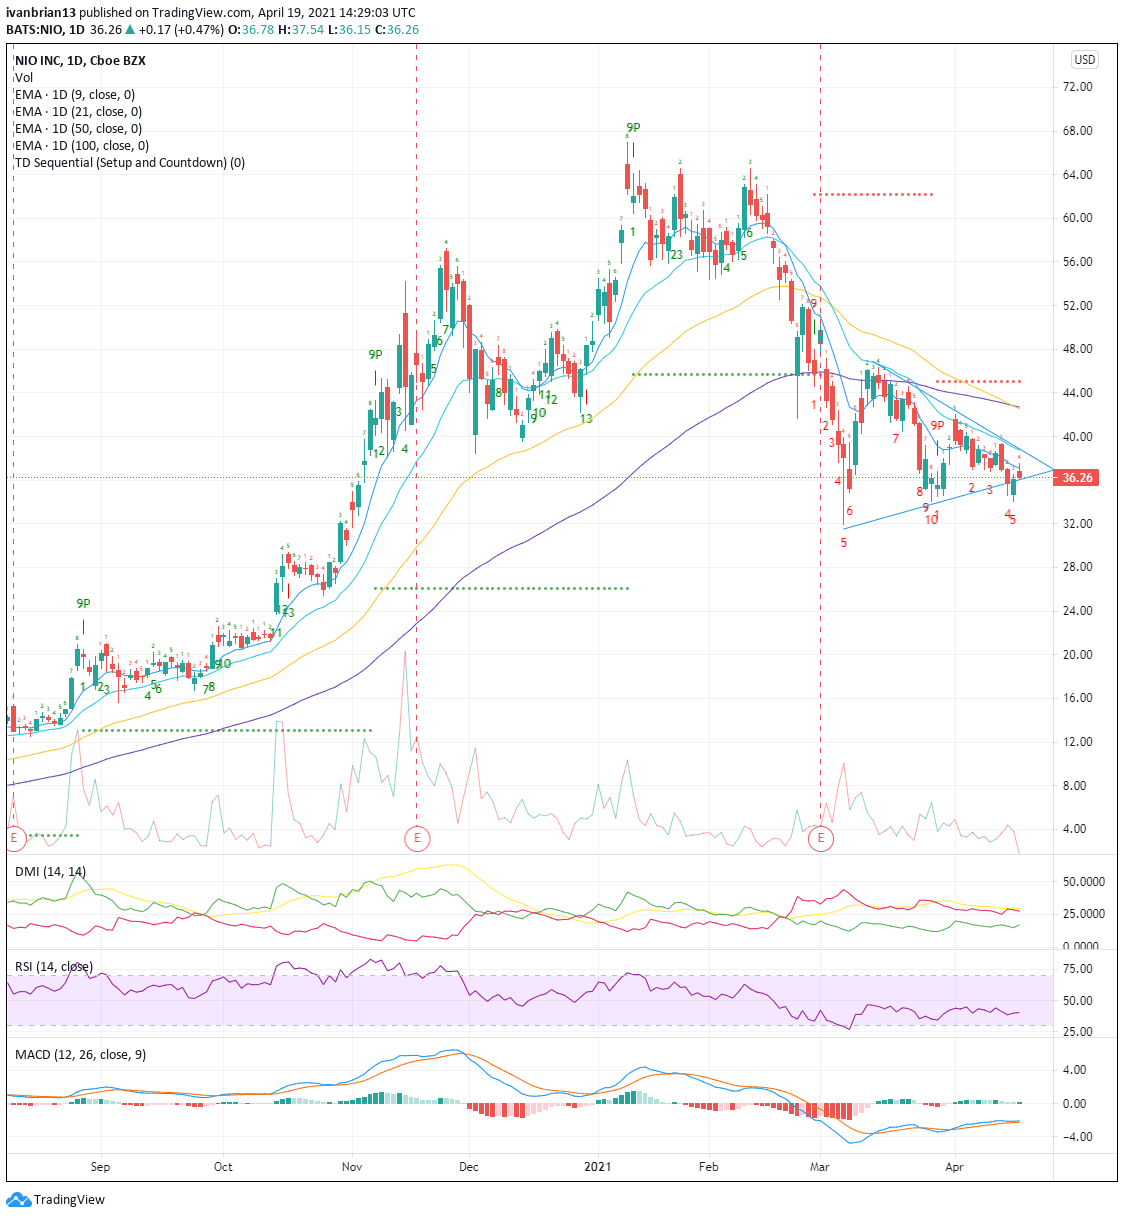
Update 2 April 19: NIO shares are rising despite sector leader Tesla suffering a heavy fall on Monday. Tesla (TSLA) shares are down 5.5% while NIO is up 1%. Technically NIO is still looking for a confirming move from its tightening triangle formation. A false break on Friday was swiftly rebutted with a close higher than the low. The move has now put in a double bottom which needs to hold. The first target is for NIO to break above the 9 day moving average at $37.11 with the 21 day moving average resistance at $38.76. This would just see a breakout of the triangle to the upside with a $14 range higher as the target as this is the entry length of the triangle.
Update April 19: Nio Inc (NYSE: NIO) has closed Friday's trading session with an increase of 1.2% to $36.09 – creating a double-bottom on the charts after bouncing off the $35 handle also in late March. One of the reasons for the upswing is Nio's deal with Sinopec to supply 5,000 battery swap stations in their network by 2025. The Chinese EV maker's expanding venture serves as a boost to its equity.
Update, April 15: NIO lost nearly 4% on Wednesday and extended its slide to a fresh two-week low of $34.55. As of writing, NIO was trading at $35.60, down 3.9% on a daily basis. The stock seems to be struggling to capitalize on the upbeat market mood on Thursday despite a lack of company-specific headlines. Currently, the Nasdaq Composite is up 1.45% at 14,004 and remains within a touching distance of the record-high it set at 14,175 on February 16. Furthermore, the S&P 500 Technology Index is rising nearly 2%. Investors are likely to remain focused on the technical outlook in the near term.
Update: NIO shares are lower on Thursday as Tesla suffered sharp falls on Wednesday. Tesla was dumped by ARK Invest as they opted for some COIN instead! NIO has formed a triangle formation. Breakouts of triangle formations are sharp and usually the size of the entry range.
Update April 16: Nio Inc (NYSE: NIO) has kicked off Friday's trading session with a dive under $35, but has since been on a recovery path, aiming to close the gap and changing hands at $35.20, a drop of only 1%. Shares of electric vehicles are struggling to make headway. Churchill Capital, which is SPAC-merging with Lucid Motors, is also struggling. The global chip shortage is one of the reasons that the broader automobile sector is on the back foot.
At the time of writing, the author has no position in any stock mentioned in this article and no business relationship with any company mentioned. The author has not received compensation for writing this article, other than from FXStreet.
This article is for information purposes only. The author and FXStreet are not registered investment advisors and nothing in this article is intended to be investment advice. It is important to perform your own research before making any investment and take independent advice from a registered investment advisor.
FXStreet and the author do not provide personalized recommendations. The author makes no representations as to accuracy, completeness, or the suitability of this information. FXStreet and the author will not be liable for any errors, omissions or any losses, injuries or damages arising from this information and its display or use. The author will not be held responsible for information that is found at the end of links posted on this page.
Errors and omissions excepted.
Information on these pages contains forward-looking statements that involve risks and uncertainties. Markets and instruments profiled on this page are for informational purposes only and should not in any way come across as a recommendation to buy or sell in these assets. You should do your own thorough research before making any investment decisions. FXStreet does not in any way guarantee that this information is free from mistakes, errors, or material misstatements. It also does not guarantee that this information is of a timely nature. Investing in Open Markets involves a great deal of risk, including the loss of all or a portion of your investment, as well as emotional distress. All risks, losses and costs associated with investing, including total loss of principal, are your responsibility. The views and opinions expressed in this article are those of the authors and do not necessarily reflect the official policy or position of FXStreet nor its advertisers. The author will not be held responsible for information that is found at the end of links posted on this page.
If not otherwise explicitly mentioned in the body of the article, at the time of writing, the author has no position in any stock mentioned in this article and no business relationship with any company mentioned. The author has not received compensation for writing this article, other than from FXStreet.
FXStreet and the author do not provide personalized recommendations. The author makes no representations as to the accuracy, completeness, or suitability of this information. FXStreet and the author will not be liable for any errors, omissions or any losses, injuries or damages arising from this information and its display or use. Errors and omissions excepted.
The author and FXStreet are not registered investment advisors and nothing in this article is intended to be investment advice.
Recommended content
Editors’ Picks

USD/JPY slumps to three-week low amid Trump's tariffs-inspired risk-off impulse
USD/JPY dives to a three-week low during the Asian session on Thursday as Trump's sweeping trade tariffs provide a strong boost to traditional safe-haven assets. The anti-risk flow triggers a steep decline in the US Treasury bond yields, which drags the USD back closer to a multi-month low touched in March.

AUD/USD remains weak below 0.6300 despite upbeat Chinese PMI data
The AUD/USD pair remains under selling pressure around 0.6280 during the early Asian session on Thursday. The Australian Dollar pares losses against the Greenback after the stronger Chinese economic data. However, the upside might be limited as US President Donald Trump announced sweeping global reciprocal tariffs, prompting traders to turn cautious.

Gold price corrects from record high as focus shifts to US NFP data
Gold price is correcting sharply from a new record high of $3,168 reached in the early Asian session on Thursday. Despite the pullback, Gold price preserves a significant part of the recent record run, courtesy of escalating risks of a global trade war and a US recession.

Bitcoin and top altcoins slide as Trump kicks off reciprocal tariffs
Bitcoin and the entire crypto market saw a quick correction on Wednesday following President Donald Trump's reciprocal tariff announcements based on half of each country's respective rates.

Trump’s “Liberation Day” tariffs on the way
United States (US) President Donald Trump’s self-styled “Liberation Day” has finally arrived. After four straight failures to kick off Donald Trump’s “day one” tariffs that were supposed to be implemented when President Trump assumed office 72 days ago, Trump’s team is slated to finally unveil a sweeping, lopsided package of “reciprocal” tariffs.

The Best brokers to trade EUR/USD
SPONSORED Discover the top brokers for trading EUR/USD in 2025. Our list features brokers with competitive spreads, fast execution, and powerful platforms. Whether you're a beginner or an expert, find the right partner to navigate the dynamic Forex market.


