NIKKEI 225 (N225) Index Elliott Wave technical analysis [Video]
![NIKKEI 225 (N225) Index Elliott Wave technical analysis [Video]](https://editorial.fxstreet.com/images/Markets/Equities/SP500/wall_street_nyse3-637299021683820849_XtraLarge.jpg)
NIKKEI 225 (N225) Elliott Wave Analysis - Day Chart
NIKKEI 225 (N225) Elliott Wave technical analysis
Technical Details
-
Function: Bullish Trend.
-
Mode: Impulsive.
-
Structure: Orange Wave 1.
-
Position: Navy Blue Wave 3.
-
Direction next lower degrees: Orange Wave 2.
-
Details: Navy Blue Wave 2 appears complete; orange Wave 1 within Navy Blue Wave 3 is now in play.
-
Wave cancel invalid level: 37,650.
The NIKKEI 225 day chart analysis highlights a bullish trend in alignment with Elliott Wave theory. The market is currently in an impulsive phase, indicating strong upward momentum. The structure focuses on orange wave 1, which is unfolding as part of a larger navy blue wave 3. This progression signals that the upward movement is in its early stages, with room for further gains.
The analysis shows that Navy Blue Wave 2 has concluded, marking the end of the previous corrective phase. With this phase complete, the market has now entered orange wave 1 within the broader navy blue wave 3. This transition indicates the beginning of a fresh upward impulsive wave, aligning with the overarching bullish trend.
Outlook
The next lower degree points to orange wave 2, which could introduce a temporary correction following the completion of orange wave 1. However, this corrective phase has not yet begun, as the primary focus remains on the continued upward development of orange wave 1.
Critical invalidation level
The wave cancel invalid level is set at 37,650. A drop below this level would invalidate the current Elliott Wave count and require a reassessment of the market structure. This level is crucial for risk management and monitoring potential shifts in market direction.
Summary
The NIKKEI 225 day chart displays a robust bullish trend, supported by the completion of navy blue wave 2 and the active progression of orange wave 1 within navy blue wave 3. The ongoing impulsive phase reflects strong upward momentum, with further price gains anticipated before any corrective phase occurs. Traders should maintain a bullish outlook while closely watching the invalidation level at 37,650 to manage risks effectively.

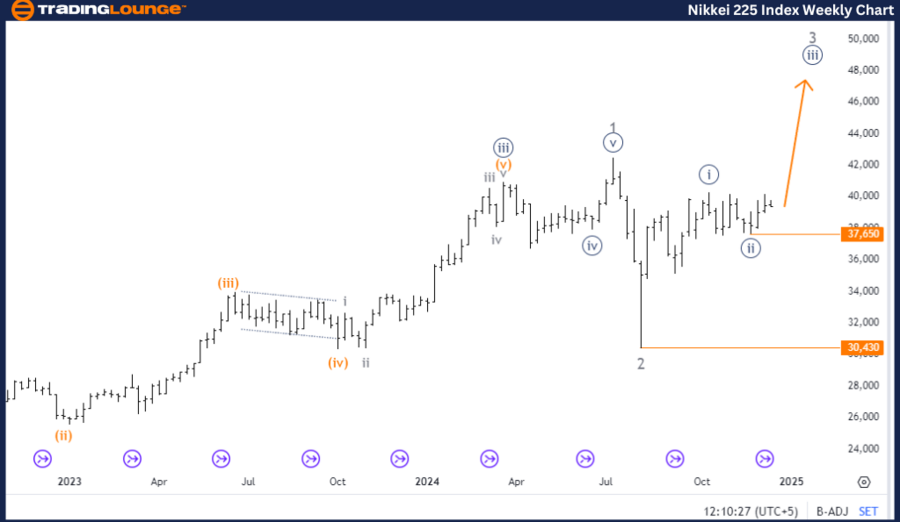
NIKKEI 225 (N225) Elliott Wave Analysis - Weekly Chart.
NIKKEI 225 (N225) Elliott Wave technical analysis
Technical Details
-
Function: Bullish Trend.
-
Mode: Impulsive.
-
Structure: Navy Blue Wave 3.
-
Position: Gray Wave 3.
-
Direction next lower degrees: Navy Blue Wave 4.
-
Details: Navy blue wave 2 appears complete; navy blue wave 3 is currently in play.
-
Wave cancel invalid level: 30,430.
The NIKKEI 225 weekly chart analysis confirms a bullish trend in alignment with Elliott Wave principles. The market is currently in an impulsive phase, reflecting strong upward momentum. The focus is on navy blue wave 3, which is actively unfolding as part of a broader bullish cycle.
The analysis indicates that navy blue wave 2 has concluded, marking the end of a corrective phase. Following this, the market entered navy blue wave 3, an impulsive wave signaling robust upward movement and sustained market strength. This progression highlights that the bullish trend remains firmly intact, with further potential for gains.
Position and outlook
The market’s current position is within gray wave 3, which aligns with the broader navy blue wave 3. This intermediate phase indicates a continuation of the bullish trend, with no significant signs of reversal at this stage. The next lower-degree direction points toward navy blue wave 4, signaling that once navy blue wave 3 concludes, a temporary correction may occur before the upward trend resumes.
Critical invalidation level
The wave cancel invalid level is set at 30,430. A decline below this level would invalidate the current Elliott Wave count, requiring a reassessment of the market’s structure. This benchmark is essential for traders to manage risks effectively and confirm the trend’s direction.
Summary
The NIKKEI 225 weekly chart reflects a clear bullish trend supported by the completion of navy blue wave 2 and the ongoing development of navy blue wave 3. The current impulsive movement demonstrates strong upward momentum, with further price gains anticipated before any corrective phase begins. Traders should maintain a bullish outlook while monitoring the invalidation level at 30,430 for any potential changes in market dynamics.
Technical analyst: Malik Awais.
NIKKEI 225 (N225) Elliott Wave technical analysis [Video]
Author

Peter Mathers
TradingLounge
Peter Mathers started actively trading in 1982. He began his career at Hoei and Shoin, a Japanese futures trading company.


