NIKKEI 225 (N225) Elliott Wave Analysis - Day Chart
NIKKEI 225 (N225) Elliott Wave technical analysis
Technical Details
-
Function: Bullish Trend.
-
Mode: Impulsive.
-
Structure: Orange Wave 1.
-
Position: Navy Blue Wave 3.
-
Direction next lower degrees: Orange Wave 2.
-
Details: Navy Blue Wave 2 appears complete; orange Wave 1 within Navy Blue Wave 3 is now in play.
-
Wave cancel invalid level: 37,650.
The NIKKEI 225 day chart analysis highlights a bullish trend in alignment with Elliott Wave theory. The market is currently in an impulsive phase, indicating strong upward momentum. The structure focuses on orange wave 1, which is unfolding as part of a larger navy blue wave 3. This progression signals that the upward movement is in its early stages, with room for further gains.
The analysis shows that Navy Blue Wave 2 has concluded, marking the end of the previous corrective phase. With this phase complete, the market has now entered orange wave 1 within the broader navy blue wave 3. This transition indicates the beginning of a fresh upward impulsive wave, aligning with the overarching bullish trend.
Outlook
The next lower degree points to orange wave 2, which could introduce a temporary correction following the completion of orange wave 1. However, this corrective phase has not yet begun, as the primary focus remains on the continued upward development of orange wave 1.
Critical invalidation level
The wave cancel invalid level is set at 37,650. A drop below this level would invalidate the current Elliott Wave count and require a reassessment of the market structure. This level is crucial for risk management and monitoring potential shifts in market direction.
Summary
The NIKKEI 225 day chart displays a robust bullish trend, supported by the completion of navy blue wave 2 and the active progression of orange wave 1 within navy blue wave 3. The ongoing impulsive phase reflects strong upward momentum, with further price gains anticipated before any corrective phase occurs. Traders should maintain a bullish outlook while closely watching the invalidation level at 37,650 to manage risks effectively.

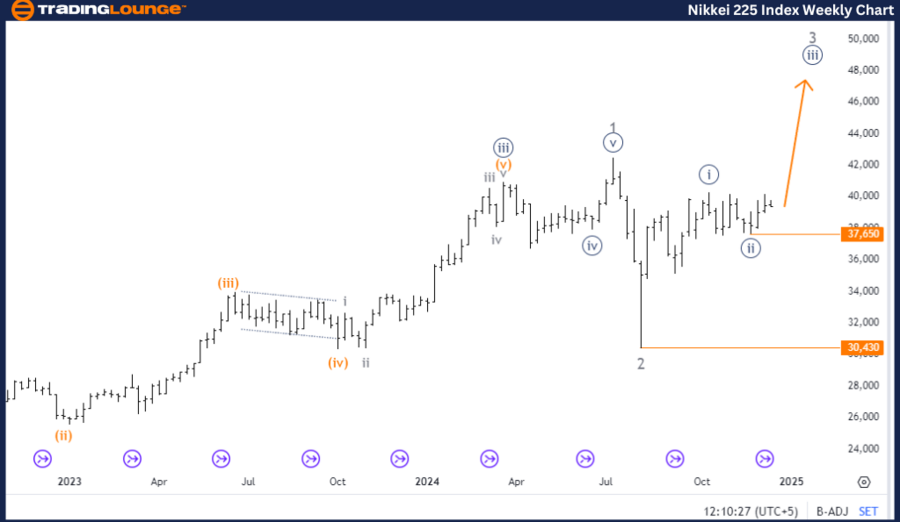
NIKKEI 225 (N225) Elliott Wave Analysis - Weekly Chart.
NIKKEI 225 (N225) Elliott Wave technical analysis
Technical Details
-
Function: Bullish Trend.
-
Mode: Impulsive.
-
Structure: Navy Blue Wave 3.
-
Position: Gray Wave 3.
-
Direction next lower degrees: Navy Blue Wave 4.
-
Details: Navy blue wave 2 appears complete; navy blue wave 3 is currently in play.
-
Wave cancel invalid level: 30,430.
The NIKKEI 225 weekly chart analysis confirms a bullish trend in alignment with Elliott Wave principles. The market is currently in an impulsive phase, reflecting strong upward momentum. The focus is on navy blue wave 3, which is actively unfolding as part of a broader bullish cycle.
The analysis indicates that navy blue wave 2 has concluded, marking the end of a corrective phase. Following this, the market entered navy blue wave 3, an impulsive wave signaling robust upward movement and sustained market strength. This progression highlights that the bullish trend remains firmly intact, with further potential for gains.
Position and outlook
The market’s current position is within gray wave 3, which aligns with the broader navy blue wave 3. This intermediate phase indicates a continuation of the bullish trend, with no significant signs of reversal at this stage. The next lower-degree direction points toward navy blue wave 4, signaling that once navy blue wave 3 concludes, a temporary correction may occur before the upward trend resumes.
Critical invalidation level
The wave cancel invalid level is set at 30,430. A decline below this level would invalidate the current Elliott Wave count, requiring a reassessment of the market’s structure. This benchmark is essential for traders to manage risks effectively and confirm the trend’s direction.
Summary
The NIKKEI 225 weekly chart reflects a clear bullish trend supported by the completion of navy blue wave 2 and the ongoing development of navy blue wave 3. The current impulsive movement demonstrates strong upward momentum, with further price gains anticipated before any corrective phase begins. Traders should maintain a bullish outlook while monitoring the invalidation level at 30,430 for any potential changes in market dynamics.
Technical analyst: Malik Awais.
NIKKEI 225 (N225) Elliott Wave technical analysis [Video]
As with any investment opportunity there is a risk of making losses on investments that Trading Lounge expresses opinions on.
Historical results are no guarantee of future returns. Some investments are inherently riskier than others. At worst, you could lose your entire investment. TradingLounge™ uses a range of technical analysis tools, software and basic fundamental analysis as well as economic forecasts aimed at minimizing the potential for loss.
The advice we provide through our TradingLounge™ websites and our TradingLounge™ Membership has been prepared without considering your objectives, financial situation or needs. Reliance on such advice, information or data is at your own risk. The decision to trade and the method of trading is for you alone to decide. This information is of a general nature only, so you should, before acting upon any of the information or advice provided by us, consider the appropriateness of the advice considering your own objectives, financial situation or needs. Therefore, you should consult your financial advisor or accountant to determine whether trading in securities and derivatives products is appropriate for you considering your financial circumstances.


Recommended content
Editors’ Picks

Gold gives away part of its earlier advance to $3,500
Gold retreated from its earlier record top of $3,500 per troy ounce as overbought signals and the rebound in the US Dollar seem to have prompted buyers to take a breather. Meanwhile, all the attention remains on the Trump-Powell effervescence and upcoming comments from Fed officials.

EUR/USD drops to daily lows near 1.1470, Dollar regains balance
EUR/USD slips back below the 1.1500 mark, trimming part of Monday’s rally as the Greenback picks up some upside momentum following recent multi-year losses. In the meantime, markets remain cautious in light of President Trump’s criticism of Fed Chair Jerome Powell and its potential implications for the US markets.

GBP/USD looks consolidative below 1.3400 on USD buying
GBP/USD drifts within a narrow band below the 1.3400 hurdle as the Greenback’s decent rebound continues to gather steam on Tuesday. Still, lingering worries over a US economic slowdown and doubts about the Fed’s independence are expected to limit Cable’s downside potential.

3% of Bitcoin supply in control of firms with BTC on balance sheets: The good, bad and ugly
Bitcoin disappointed traders with lackluster performance in 2025, hitting the $100,000 milestone and consolidating under the milestone thereafter. Bitcoin rallied past $88,000 early on Monday, the dominant token eyes the $90,000 level.

Five fundamentals for the week: Traders confront the trade war, important surveys, key Fed speech Premium
Will the US strike a trade deal with Japan? That would be positive progress. However, recent developments are not that positive, and there's only one certainty: headlines will dominate markets. Fresh US economic data is also of interest.

The Best brokers to trade EUR/USD
SPONSORED Discover the top brokers for trading EUR/USD in 2025. Our list features brokers with competitive spreads, fast execution, and powerful platforms. Whether you're a beginner or an expert, find the right partner to navigate the dynamic Forex market.