NIKKEI 225 (N225) Elliott Wave Analysis Trading Lounge Day Chart
NIKKEI 225 (N225) Elliott Wave technical analysis
Function: Trend.
Mode: Impulsive.
Structure: Navy Blue Wave 1.
Position: Gray Wave 3.
Direction next lower degrees: Navy Blue Wave 2.
Details: Gray Wave 2 appears to be complete, with Navy Blue Wave 1 currently unfolding.
Wave Cancel Invalid Level: 30,308.
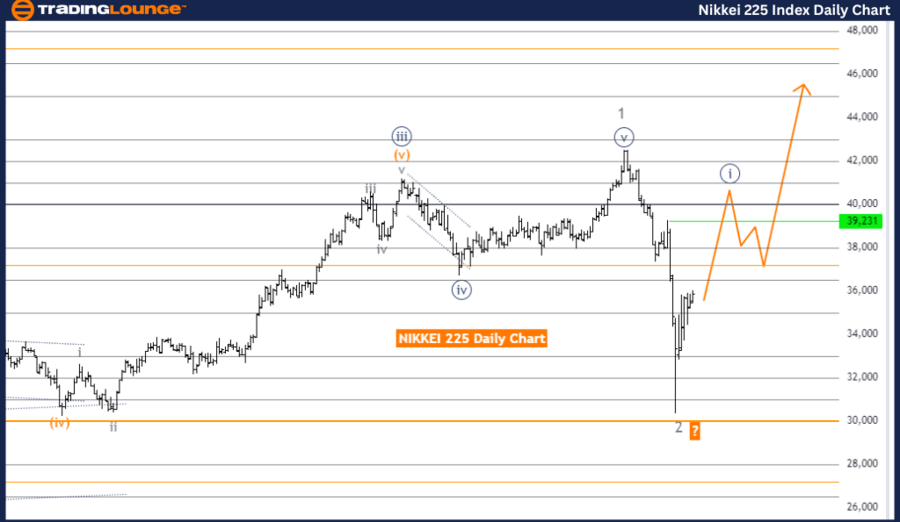
The NIKKEI 225 Elliott Wave Analysis on the daily chart concentrates on the ongoing market trend, described as impulsive. This analysis outlines the structure of Navy Blue Wave 1, which is now active. This wave is part of the larger Gray Wave 3, indicating a robust upward momentum in this wave sequence.
Prior to Navy Blue Wave 1, Gray Wave 2, a corrective phase, seems to have concluded. With Gray Wave 2 deemed complete, the market has transitioned into the impulsive Navy Blue Wave 1. This shift signals the start of a new upward phase, indicating a continuation of the broader trend within the NIKKEI 225 index.
As the market advances within Navy Blue Wave 1, the next anticipated phase is Navy Blue Wave 2, likely to bring a corrective move following the completion of the current impulsive phase. However, the main focus remains on the formation and completion of Navy Blue Wave 1, which is currently propelling the market upwards.
A critical level to watch in this wave analysis is the wave cancel invalid level, set at 30,308. This threshold is essential, as falling below it would invalidate the current Elliott Wave count. If the market drops below this level, it could indicate that the anticipated upward movement within Navy Blue Wave 1 may not occur as expected, potentially signaling a change in market direction.
In summary, the NIKKEI 225 Elliott Wave Analysis on the daily chart suggests that the market is in an impulsive phase within Navy Blue Wave 1, following the completion of Gray Wave 2. The analysis indicates continued upward movement, with the invalidation level at 30,308 being crucial to confirming the ongoing wave structure.
NIKKEI 225 (N225) Elliott Wave Analysis Trading Lounge Weekly Chart
NIKKEI 225 (N225) Elliott Wave Technical Analysis
Function: Trend.
Mode: Impulsive.
Structure: Gray Wave 3.
Direction next lower degrees: Gray Wave 3 (Started).
Details: Gray Wave 2 appears to be complete, with Gray Wave 3 now in progress.
Wave cancel invalid level: 30,308.
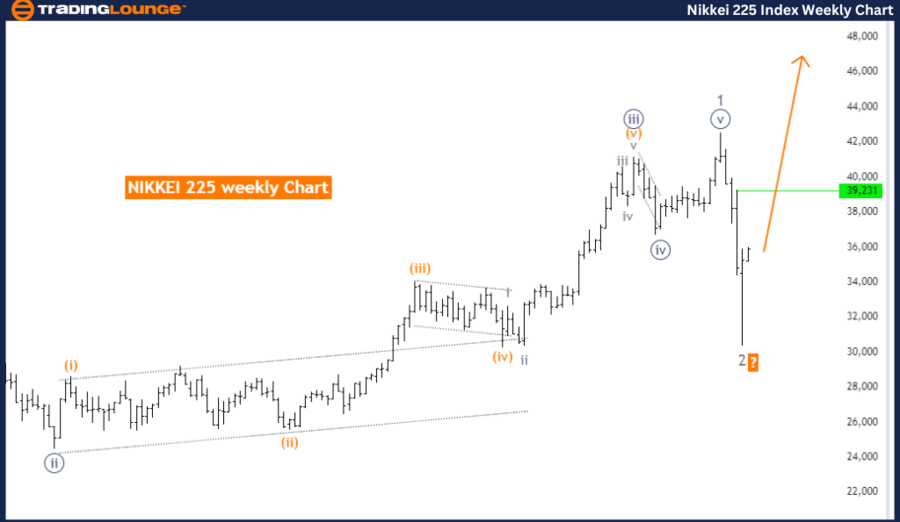
The NIKKEI 225 Elliott Wave Analysis on the weekly chart highlights a strong upward trend currently underway. The market is described as impulsive, indicating a clear and sustained movement, specifically within the structure of Gray Wave 3. This wave represents a significant phase of market activity that is contributing to the overall upward trend.
Before this current wave, the market completed Gray Wave 2, a corrective phase that offered a temporary pullback in the market’s trajectory. With Gray Wave 2 now considered complete, the focus has shifted to Gray Wave 3, which has begun and is driving the market higher. This suggests that the market is now in a powerful and potentially enduring phase of upward momentum.
As Gray Wave 3 advances, it marks an important stage in the Elliott Wave cycle, with expectations for continued upward movement. This wave represents the continuation of the broader trend, implying that the market is likely to experience further gains as this wave develops.
The analysis points to a critical invalidation level at 30,308. This level is crucial because if the market falls below this point, it would invalidate the current Elliott Wave count. Such a move would imply that the expected upward trend within Gray Wave 3 might not proceed as anticipated, potentially signaling a shift in market direction.
In summary, the NIKKEI 225 Elliott Wave Analysis on the weekly chart suggests that the market is currently in an impulsive Gray Wave 3, following the completion of Gray Wave 2. The analysis indicates that the upward trend is likely to continue, with the invalidation level at 30,308 being a key point to monitor for confirming the ongoing wave structure.
Technical analyst: Malik Awais.
NIKKEI 225 (N225) Elliott Wave technical analysis [Video]
As with any investment opportunity there is a risk of making losses on investments that Trading Lounge expresses opinions on.
Historical results are no guarantee of future returns. Some investments are inherently riskier than others. At worst, you could lose your entire investment. TradingLounge™ uses a range of technical analysis tools, software and basic fundamental analysis as well as economic forecasts aimed at minimizing the potential for loss.
The advice we provide through our TradingLounge™ websites and our TradingLounge™ Membership has been prepared without considering your objectives, financial situation or needs. Reliance on such advice, information or data is at your own risk. The decision to trade and the method of trading is for you alone to decide. This information is of a general nature only, so you should, before acting upon any of the information or advice provided by us, consider the appropriateness of the advice considering your own objectives, financial situation or needs. Therefore, you should consult your financial advisor or accountant to determine whether trading in securities and derivatives products is appropriate for you considering your financial circumstances.
Recommended content
Editors’ Picks

EUR/USD hovers around 1.0400 amid a souring mood
EUR/USD loses its early traction but holds within familiar levels around the 1.0400 area on Monday. The negative shift seen in risk mood, as reflected by Wall Street's bearish opening, supports the US Dollar and makes it difficult for the pair to hold its ground.

GBP/USD stabilizes around 1.2550 in dull trading
GBP/USD turned south and dropped toward 1.2500 after reaching a 10-day-high above 1.2600 earlier in the day. The pair recovered as fears eased and stabilized around 1.2550 in holiday-thinned trading. Demand for safety skews the risk to the downside.

Gold struggles around $2,600 as USD demand recedes
Gold briefly traded below the $2,600 level in the American session on Monday, with US Dollar demand backed by the poor performance of global equities and exacerbated by thin trading conditions ahead of New Year's Eve.

These three narratives could fuel crypto in 2025, experts say
Crypto market experienced higher adoption and inflow of institutional capital in 2024. Experts predict the trends to look forward to in 2025, as the market matures and the Bitcoin bull run continues.

Three Fundamentals: Year-end flows, Jobless Claims and ISM Manufacturing PMI stand out Premium
Money managers may adjust their portfolios ahead of the year-end. Weekly US Jobless Claims serve as the first meaningful release in 2025. The ISM Manufacturing PMI provides an initial indication ahead of Nonfarm Payrolls.

Best Forex Brokers with Low Spreads
VERIFIED Low spreads are crucial for reducing trading costs. Explore top Forex brokers offering competitive spreads and high leverage. Compare options for EUR/USD, GBP/USD, USD/JPY, and Gold.