Nikkei 225 (N225) Elliott Wave technical analysis [Video]
![Nikkei 225 (N225) Elliott Wave technical analysis [Video]](https://editorial.fxstreet.com/images/Markets/Equities/Nikkei/nikkei-225-index-17329557_XtraLarge.jpg)
Nikkei 225 (N225) Elliott Wave technical analysis
-
Function: Trend.
-
Mode: Impulsive.
-
Structure: Navy blue wave 3.
-
Position: Gray wave 3.
-
Direction (next higher degrees): Navy blue wave 4.
-
Details: Navy blue wave 2 appears complete, with navy blue wave 3 now in progress.
-
Wave cancel invalidation level: 35,109.
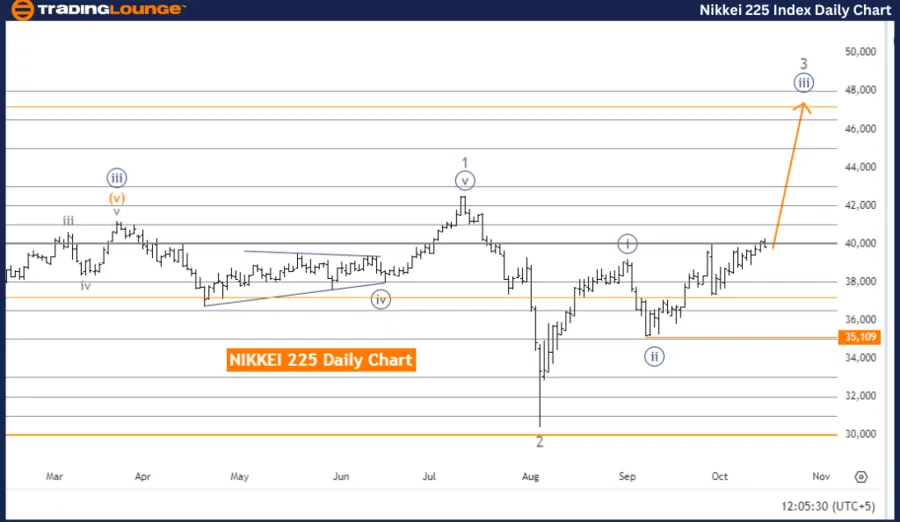
The NIKKEI 225 Elliott Wave analysis on the daily chart indicates that the market is moving within a trend, following an impulsive wave structure. The active wave is navy blue wave 3, nested within the larger gray wave 3 formation. With navy blue wave 2 completed, the unfolding of navy blue wave 3 points to further upward momentum in line with the impulsive wave framework.
Typically, wave 3 within the Elliott Wave structure represents a strong price advance, suggesting that the NIKKEI 225 will likely continue climbing as the wave develops. The next major point to observe will be navy blue wave 4, a corrective phase expected after the conclusion of the ongoing bullish wave 3.
The invalidation level is established at 35,109. If the market price drops below this level, the current Elliott Wave structure will be invalidated, requiring a fresh evaluation of the wave count. However, as long as the price holds above this level, the bullish trend remains intact, with more upward movement expected within the impulsive wave.
Summary
The NIKKEI 225 is currently in a bullish trend, driven by navy blue wave 3 within gray wave 3. The completion of navy blue wave 2 has set the stage for the present upward movement. Traders should monitor the development of navy blue wave 3, as well as the upcoming navy blue wave 4, which will introduce a corrective phase. The critical invalidation level at 35,109 must be observed for any signs of changes in the wave structure.
Nikkei 225 (N225) Elliott Wave technical analysis
-
Function: Trend.
-
Mode: Impulsive.
-
Structure: Navy blue wave 3.
-
Position: Gray wave 3.
-
Direction (next higher degrees): Navy blue wave 4.
-
Details: Navy blue wave 2 looks completed; navy blue wave 3 is now unfolding.
-
Wave cancel invalidation level: 35,109.
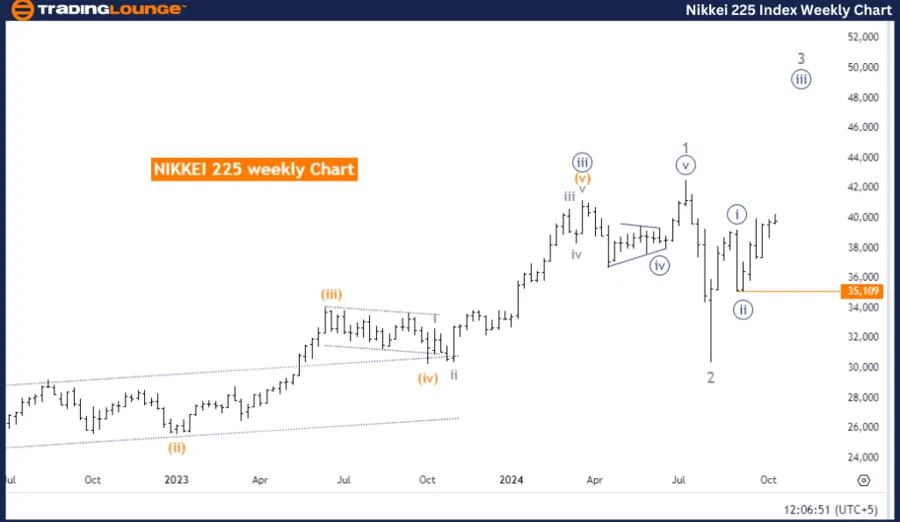
The NIKKEI 225 Elliott Wave analysis on the weekly chart reflects a bullish trend, driven by an impulsive wave structure. The active wave in progress is navy blue wave 3, part of the broader gray wave 3 pattern. The completion of navy blue wave 2 indicates that the market has entered the third wave, which is known for producing strong upward movement in the Elliott Wave cycle.
As navy blue wave 3 continues, the market remains in a bullish phase, suggesting further potential price gains. This wave is expected to unfold until gray wave 3 completes. Following the conclusion of gray wave 3, the market is likely to transition into navy blue wave 4, introducing a corrective pullback before the upward trend resumes.
The key invalidation level for the current wave structure is 35,109. If the price falls below this threshold, the wave count will become invalid, requiring a reevaluation of the trend. However, as long as the market stays above this level, the bullish momentum is expected to persist, with navy blue wave 3 actively in progress.
Summary
The NIKKEI 225 is in a strong upward trend, driven by navy blue wave 3 within the larger gray wave 3 structure. The completion of navy blue wave 2 signals the start of this impulsive movement. The next key development will be navy blue wave 4, marking a corrective phase after the completion of the current wave. Monitoring the invalidation level at 35,109 is essential to confirm the wave structure and ensure the continuation of the bullish trend.
Nikkei 225 (N225) Elliott Wave technical analysis [Video]
Author

Peter Mathers
TradingLounge
Peter Mathers started actively trading in 1982. He began his career at Hoei and Shoin, a Japanese futures trading company.


