NIKKEI 225 (N225) Elliott Wave technical analysis [Video]
![NIKKEI 225 (N225) Elliott Wave technical analysis [Video]](https://editorial.fxstreet.com/images/Markets/Equities/display-panel-of-daily-stock-market-59908972_XtraLarge.jpg)
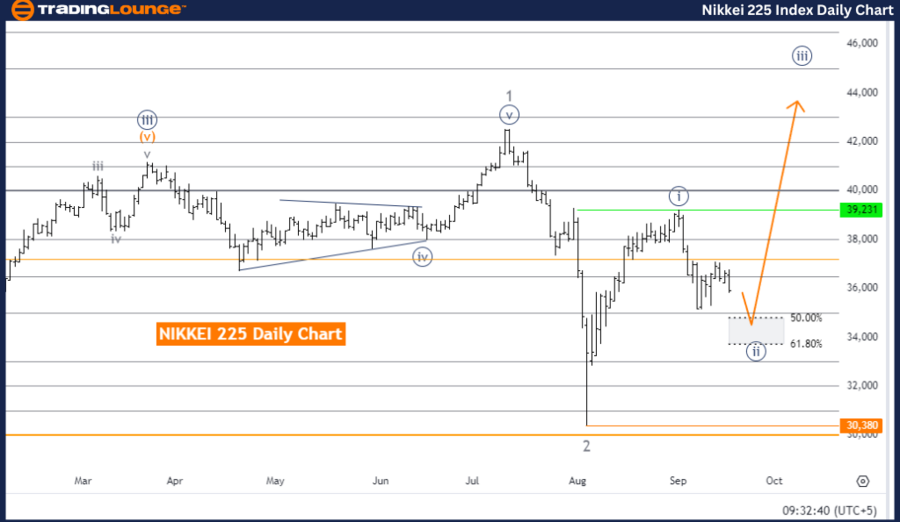
NIKKEI 225 (N225) Elliott Wave Analysis Day Chart.
NIKKEI 225 (N225) Elliott Wave technical analysis
Function: Counter Trend.
Mode: Corrective.
Structure: Navy Blue Wave 2.
Position: Gray wave 3.
Direction next higher degrees: Navy blue wave 3.
Details: Navy Blue Wave 1 appears completed, and currently, Navy Blue Wave 2 is unfolding.
Wave cancel invalid level: 30,380.
The Nikkei 225 Elliott Wave analysis on the day chart points to a corrective counter-trend movement. The analysis shows that the market is now in navy blue wave 2, which is part of a broader corrective pattern. Navy Blue Wave 1 has been completed, signaling that the initial phase of the larger wave structure has concluded, and the market has transitioned into the corrective phase represented by Navy Blue Wave 2.
Elliott Wave theory suggests that after wave 1 completes, a counter-trend correction typically follows, which is evident with the development of navy blue wave 2. This phase represents a temporary retracement or consolidation within the prevailing trend, allowing the market to pause before continuing its previous momentum.
The corrective nature of Navy Blue Wave 2 implies that this wave is moving against the direction of the earlier impulse wave (Navy Blue Wave 1). Upon completion of this corrective phase, it is expected that Navy Blue Wave 3 will resume the primary trend. Wave 3, according to Elliott Wave theory, is typically the most significant and prolonged wave in the cycle, often resulting in major market shifts.
The wave cancel invalid level is set at 30,380. If the market price exceeds this level, the current Elliott Wave count would be invalid, and the corrective pattern would need reassessment. However, as long as the price remains below this threshold, the counter-trend correction of navy blue wave 2 is expected to continue.
Conclusion:
The Nikkei 225 day chart highlights that a corrective counter-trend in Navy Blue Wave 2 is in progress, following the conclusion of Navy Blue Wave 1. This bearish correction should persist unless the price surpasses the invalidation level of 30,380.
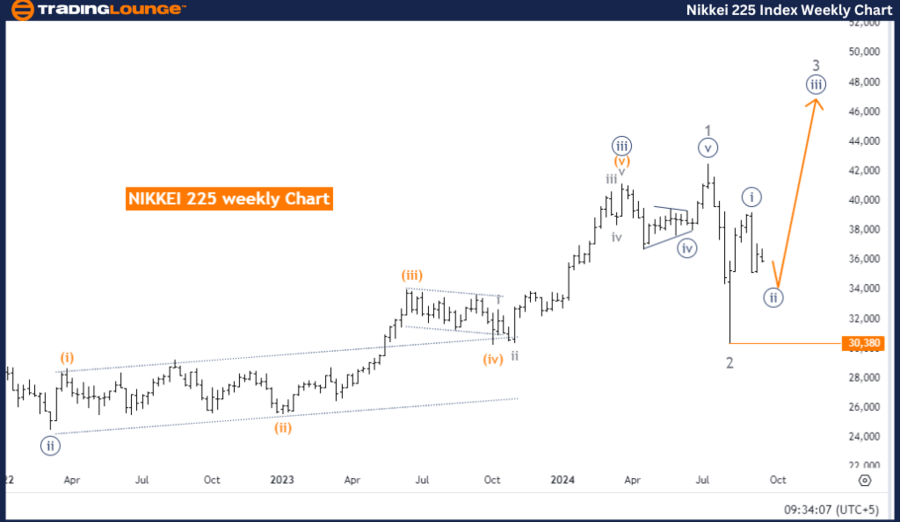
NIKKEI 225 (N225) Elliott Wave Analysis Weekly Chart.
NIKKEI 225 (N225) Elliott Wave technical analysis
Function: Counter Trend.
Mode: Corrective.
Structure: Navy Blue Wave 2.
Position: Gray wave 3
Direction next higher degrees: Navy blue wave 3.
Details: Navy Blue Wave 1 appears completed, and currently, Navy Blue Wave 2 is unfolding.
Wave cancel invalid level: 30,380.
The Nikkei 225 Elliott Wave analysis on the weekly chart shows the market is in a counter-trend corrective phase. This phase is represented by the development of Navy Blue Wave 2, following the completion of Navy Blue Wave 1. The analysis indicates that the initial impulsive wave, Navy Blue Wave 1, has concluded, and the market is now correcting within Navy Blue Wave 2.
According to Elliott Wave theory, after a strong impulsive wave, a corrective phase usually follows, allowing the market to retrace some prior gains before resuming the next trend phase. In this scenario, Navy Blue Wave 2 represents this corrective movement, which is contrary to the dominant trend set by Navy Blue Wave 1.
Navy Blue Wave 2 is classified as corrective, indicating it is moving against the trend established by Navy Blue Wave 1. This phase provides a period of consolidation or a pullback before the market is expected to resume its upward trajectory with the onset of navy blue wave 3. Elliott Wave theory suggests that wave 3 is often the strongest and most substantial wave in a cycle, likely resulting in a sharp upward movement after the corrective phase of wave 2 completes.
The wave cancel invalid level is set at 30,380. If the price rises above this level, the current wave count would be invalidated, and the wave structure would need reassessment. As long as the price stays below this threshold, the corrective phase of Navy Blue Wave 2 is expected to continue.
Summary:
The Nikkei 225 is presently in a counter-trend corrective phase, represented by Navy Blue Wave 2, following the completion of Navy Blue Wave 1. The market is expected to resume its upward trend with navy blue wave 3 after the corrective phase ends, unless the invalidation level of 30,380 is exceeded.
Technical analyst: Malik Awais.
NIKKEI 225 (N225) Elliott Wave technical analysis [Video]
Author

Peter Mathers
TradingLounge
Peter Mathers started actively trading in 1982. He began his career at Hoei and Shoin, a Japanese futures trading company.


