NIKKEI 225 Index Elliott Wave technical analysis [Video]
![NIKKEI 225 Index Elliott Wave technical analysis [Video]](https://editorial.fxstreet.com/images/Markets/Equities/DAX/dax-macro-concept-57844002_XtraLarge.jpg)
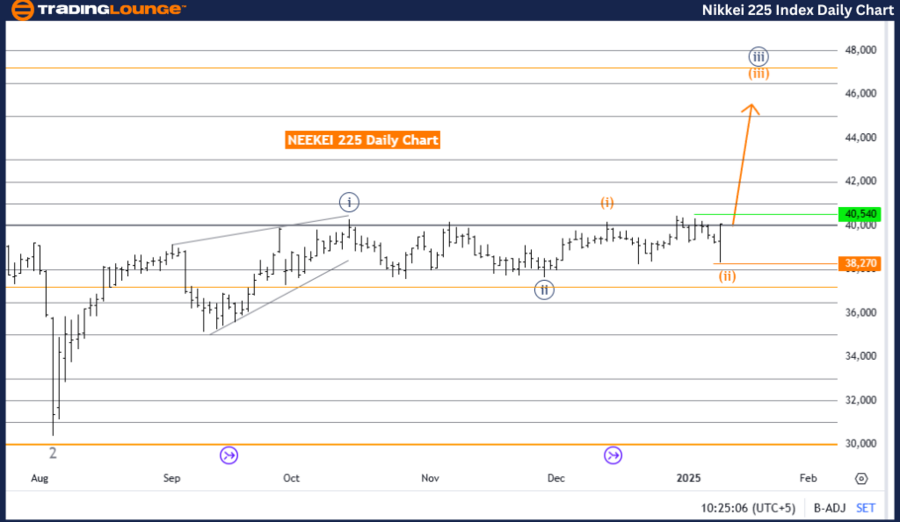
NIKKEI 225 (N225) Elliott Wave Technical Analysis Daily Chart.
NIKKEI 225 Elliott Wave technical analysis
-
Function: Bullish Trend.
-
Mode: Impulsive.
-
Structure: Orange Wave 3.
-
Position: Navy Blue Wave 3.
-
Direction next lower degrees: Orange Wave 4.
-
Details: Orange wave 2 appears complete, with orange wave 3 of navy blue wave 3 now unfolding.
-
Wave cancel invalidation level: 38,270.
The NIKKEI 225 index is displaying a bullish trend, as revealed by Elliott Wave analysis on the daily chart. The market is in an impulsive phase, with orange wave three actively progressing within the larger navy blue wave three structure. This phase highlights strong upward momentum and signifies the continuation of the broader bullish cycle.
Key Wave analysis:
-
Orange Wave Two:
Orange wave two seems to have completed, setting the stage for the emergence of orange wave three. -
Orange Wave Three:
As an impulsive wave, orange wave three typically represents the most robust and dynamic phase of the trend, characterized by notable price increases. Upon its completion, orange wave four is expected to follow as a temporary corrective pullback before the bullish trend resumes with orange wave five.
Invalidation level:
The wave structure's invalidation level is set at 38,270. If the index drops below this level, the current wave scenario will be invalidated, requiring a reassessment of the technical outlook. This threshold is critical for confirming the validity of the ongoing wave pattern.
Summary:
The NIKKEI 225 index is in a strong bullish trend, with orange wave three actively developing as part of the broader navy blue wave three. This phase signifies a period of intensified upward momentum, supported by the completion of orange wave two. The progression of orange wave three is key to affirming the market's continued bullish trajectory. Orange wave four is anticipated as the next corrective phase. The invalidation level at 38,270 serves as a vital benchmark for maintaining the Elliott Wave structure's integrity and assessing future price movements.
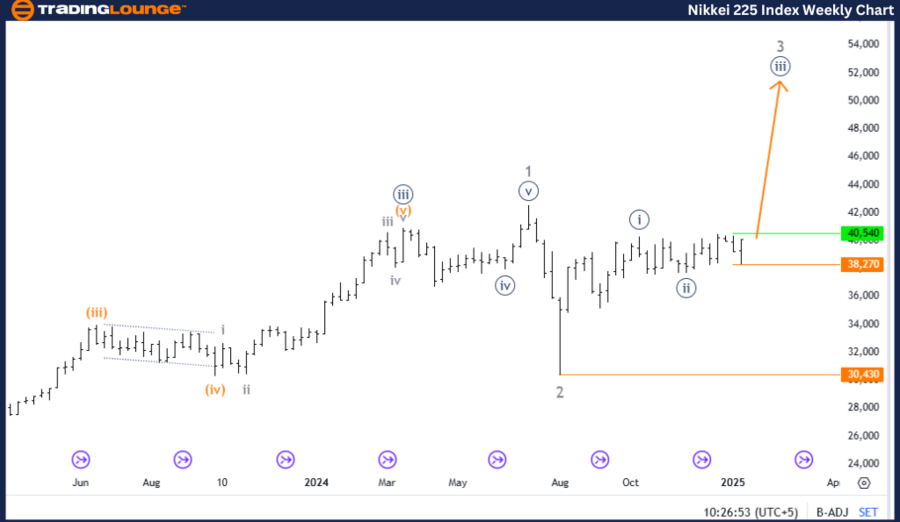
NIKKEI 225 (N225) Elliott Wave Technical Analysis Weekly Chart.
NIKKEI 225 Elliott Wave technical analysis
-
Function: Bullish Trend.
-
Mode: Impulsive.
-
Structure: Navy Blue Wave 3.
-
Position: Gray Wave 3.
-
Direction next higher degrees: Navy Blue Wave 3 (started).
-
Details: Navy blue wave 2 appears completed, with navy blue wave 3 of 3 now unfolding.
-
Wave cancel invalidation level: 30,430.
The NIKKEI 225 index is currently in a bullish trend, as detailed by Elliott Wave analysis on the weekly chart. The market is in an impulsive phase, represented by navy blue wave three, which is part of the larger gray wave three structure. This phase reflects sustained upward momentum and signals the continuation of the broader bullish trajectory.
Key Wave analysis:
-
Navy Blue Wave Two:
The completion of navy blue wave two has paved the way for navy blue wave three to begin unfolding. -
Navy Blue Wave Three:
As part of the impulsive sequence, navy blue wave three is generally the most dynamic and extended wave. This robust upward movement within gray wave three reinforces the overall strength and longevity of the bullish trend.
Invalidation level:
The wave structure will be invalidated if the index falls below 30,430. This invalidation level acts as a critical benchmark to ensure the ongoing validity of the wave structure and would necessitate a reevaluation of the technical outlook if breached.
Summary:
The NIKKEI 225 index is experiencing a pronounced bullish trend, with navy blue wave three actively unfolding within gray wave three. The transition from navy blue wave two to the current impulsive phase has marked a period of intensified upward momentum. This development supports the continuation of the bullish cycle, with navy blue wave three playing a central role in driving further market gains. The invalidation level at 30,430 ensures the structural integrity of the Elliott Wave analysis, providing a key reference for monitoring the trend's sustainability and future progression.
Technical analyst: Malik Awais.
NIKKEI 225 Elliott Wave technical analysis [Video]
Author

Peter Mathers
TradingLounge
Peter Mathers started actively trading in 1982. He began his career at Hoei and Shoin, a Japanese futures trading company.


