Nikkei 225 Elliott Wave technical analysis [Video]
![Nikkei 225 Elliott Wave technical analysis [Video]](https://editorial.fxstreet.com/images/Markets/Equities/Nikkei/nikkei-225-index-17329557_XtraLarge.jpg)
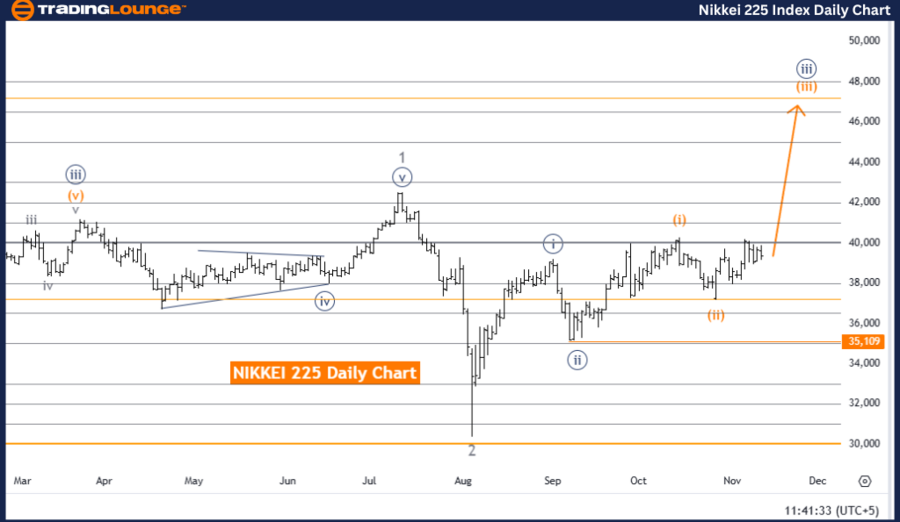
Nikkei 225 (N225) Elliott Wave Analysis Trading Lounge day chart.
Nikkei 225 (N225) Elliott Wave technical analysis
-
Function: Bullish Trend.
-
Mode: Impulsive.
-
Structure: Orange wave 3.
-
Position: Navy blue wave 3.
-
Direction next higher degrees: Orange wave 3 (started).
-
Details: Orange wave 2 appears completed; orange wave 3 is now in play.
-
Wave cancel invalidation Level: 35,109.
The NIKKEI 225 Elliott Wave analysis on the daily chart by Trading Lounge highlights a bullish trend in the Japanese stock index, driven by an impulsive wave pattern. The focus is on orange wave 3, which represents the main structure currently unfolding, signaling that the overall market sentiment remains positive.
-
Positioned within navy blue wave 3, this movement indicates a robust upward trajectory.
-
The completion of orange wave 2 confirms that orange wave 3 is now active. This stage is pivotal within the impulsive wave framework, as orange wave 3 typically aligns with strong price movements in the direction of the prevailing trend.
Key marker – Invalidation level
An invalidation level has been identified at 35,109. If the NIKKEI 225 index falls to or below this level, the ongoing progression of orange wave 3 would be considered invalid. This could suggest a potential shift in the trend or necessitate a re-evaluation of the wave structure.
Summary
The analysis maintains a bullish outlook for the NIKKEI 225, with orange wave 3 driving the current impulsive trend within navy blue wave 3. Traders should closely monitor price movements within this structure, especially around the 35,109 invalidation level. A breach of this threshold could indicate a reversal or a disruption in the current wave framework.
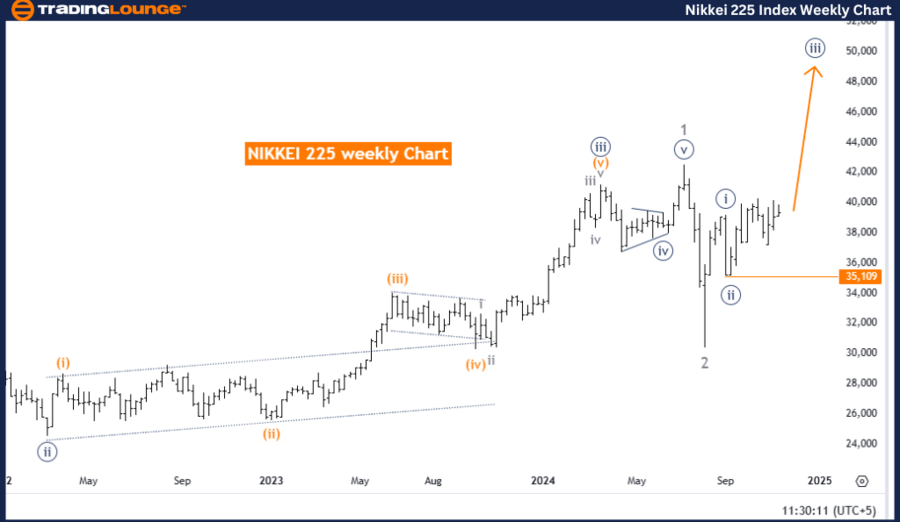
Nikkei 225 (N225) Elliott Wave Analysis Trading Lounge weekly chart.
Nikkei 225 (N225) Elliott Wave technical analysis
-
Function: Bullish Trend.
-
Mode: Impulsive.
-
Structure: Navy blue wave 3.
-
Position: Gray wave 3.
-
Direction next higher degrees: Navy blue wave 3 (continuing).
-
Details: Navy blue wave 2 appears completed; navy blue wave 3 is now in play.
-
Wave cancel invalidation level: 35,109.
The NIKKEI 225 Elliott Wave analysis on the weekly chart by Trading Lounge outlines a bullish trend in the index, driven by an impulsive wave pattern. The analysis highlights that navy blue wave 3 is the dominant structure currently unfolding, nested within gray wave 3, indicating strong upward momentum. This structure reflects the ongoing impulsive phase, signaling sustained bullish sentiment and the potential for price appreciation over the medium to long term.
-
The apparent completion of navy blue wave 2 has paved the way for the development of navy blue wave 3, a critical stage in the impulsive wave cycle.
-
Wave 3 typically represents the strongest and most extended movement within the wave structure, aligning with the overall upward trend in the NIKKEI 225.
Key marker – Invalidation level
An invalidation level has been set at 35,109. A decline to or below this level would disrupt the anticipated upward progression of navy blue wave 3, suggesting a potential shift in market sentiment or the onset of a corrective phase. Such a move would require a re-evaluation of the current wave structure.
Summary
The analysis maintains a bullish outlook for the NIKKEI 225, with navy blue wave 3 driving the impulsive trend within gray wave 3. Traders are advised to monitor price movements closely in relation to the invalidation level of 35,109. A breach of this level could indicate a disruption in the bullish structure, signaling a potential trend reversal or corrective phase.
Nikkei 225 Elliott Wave technical analysis [Video]
Author

Peter Mathers
TradingLounge
Peter Mathers started actively trading in 1982. He began his career at Hoei and Shoin, a Japanese futures trading company.


