- Nike released earnings on Thursday, beating on the top and bottom lines.
- Nike reported having higher inventory than wanted.
- NKE fell nearly 10% in afterhours trading.
Nike (NKE) was on the minds of investors Thursday as the sportswear giant unveiled its latest set of quarterly earnings. The headline results looked promising, but the stock still tanked 10% afterhours.
Nike stock news
Earnings per share (EPS) was forecast at $0.92, and it came in at $0.93. The revenue consensus forecast was at $12.2 billion and again the figure came in ahead at $12.7 billion. So far so good, right? Well, the devil is always in the details.
Inventories were up nearly $10 billion versus a year ago, a large increase. Margins were down to 44.3%, nearly two percentage points lower than last year. Margins were hit by logistics costs and that old chestnut, the strong dollar. Get ready for a swath of dollar-related margin issues in the Q3 earnings season. Nike said for 2023 it expects a $4 billion headwind from the strong dollar and a $900 million hit to bottom line EBITDA.
"Based on current spot rates, net of hedging activity, we estimate the full-year negative impact of foreign exchange on reported revenue and EBIT to now be approximately $4 billion and $900 million, respectively, creating a wide divergence in constant versus real dollar performance. [...] For the second quarter specifically, we expect reported revenue to grow low double digits on strong consumer demand despite 900 basis points of foreign exchange headwinds" said Nike CFO Matthew Freind.
Nike stock forecast
Nike was already in a powerful downtrend, and this has only added to it. Post or premarket, whichever is your fancy, Nike stock has cracked the psychological $90 area and then the pandemic support step at $92. This now opens the door to an extended decline to $60, the pandemic low. This is a huge discount to current levels but is the long-term trend.
Adding to the bearish outlook is the fact that Nike stock has cracked the 200-week moving average. This is a feat rarely achieved. The next key support is $84.26. This needs to be watched in the regular session for a reaction from the Relative Strength Index (RSI). Currently, we have a bullish divergence, which could indicate a possible short-term bottom.
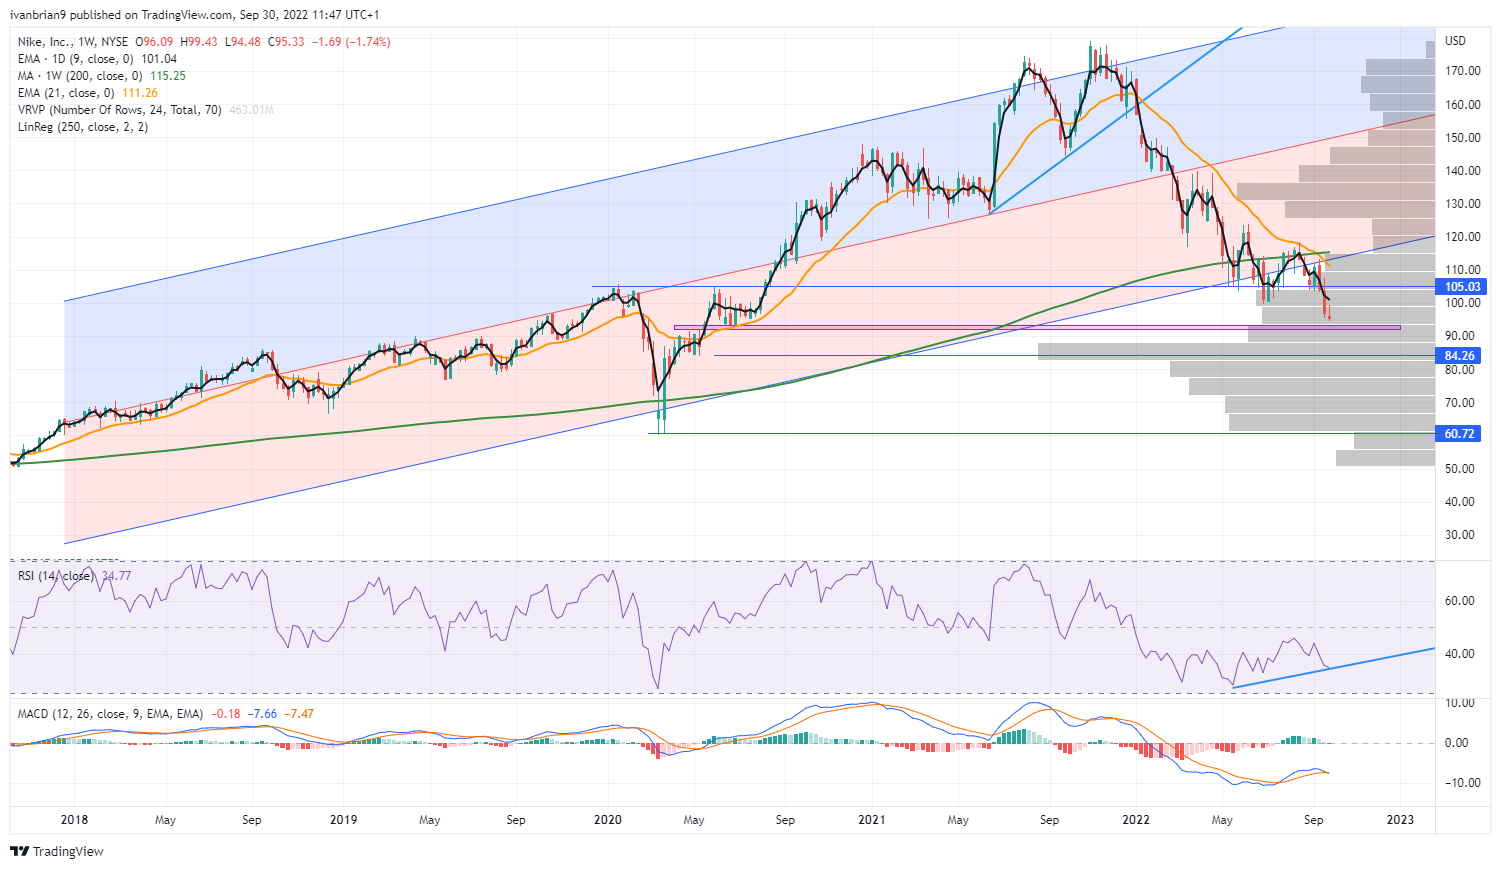
NKE weekly chart
Information on these pages contains forward-looking statements that involve risks and uncertainties. Markets and instruments profiled on this page are for informational purposes only and should not in any way come across as a recommendation to buy or sell in these assets. You should do your own thorough research before making any investment decisions. FXStreet does not in any way guarantee that this information is free from mistakes, errors, or material misstatements. It also does not guarantee that this information is of a timely nature. Investing in Open Markets involves a great deal of risk, including the loss of all or a portion of your investment, as well as emotional distress. All risks, losses and costs associated with investing, including total loss of principal, are your responsibility. The views and opinions expressed in this article are those of the authors and do not necessarily reflect the official policy or position of FXStreet nor its advertisers. The author will not be held responsible for information that is found at the end of links posted on this page.
If not otherwise explicitly mentioned in the body of the article, at the time of writing, the author has no position in any stock mentioned in this article and no business relationship with any company mentioned. The author has not received compensation for writing this article, other than from FXStreet.
FXStreet and the author do not provide personalized recommendations. The author makes no representations as to the accuracy, completeness, or suitability of this information. FXStreet and the author will not be liable for any errors, omissions or any losses, injuries or damages arising from this information and its display or use. Errors and omissions excepted.
The author and FXStreet are not registered investment advisors and nothing in this article is intended to be investment advice.
Recommended content
Editors’ Picks

EUR/USD stays below 1.0500 as markets assess German election outcome
EUR/USD struggles to build on earlier gains and stays below 1.0500 on Monday as markets assess German Conservatives Party's win in the federal election, which revived hopes for better economic outlook. The upside remains elusive due to a cautious mood and mixed German IFO data.

GBP/USD retreats below 1.2650 as markets await comments from BoE officials
GBP/USD retreats from the multi-month high it touched earlier and trades below 1.2650 on Monday. The pair eases as the US Dollar pauses its decline but the downside appears limited ahead of speeches from several BoE policymakers.

Gold climbs to an all-time high near $2,960
Prices of Gold glimmered higher on Monday, hitting an all-time high around $2,955 per ounce troy on the back of the US Dollar's inconclusive price action as investors are warming up for a key inflation report due toward the end of the week.

Bitcoin Price Forecast: BTC standoff continues
Bitcoin has been consolidating between $94,000 and $100,000 since early February. Amid this consolidation, investor sentiment remains indecisive, with US spot ETFs recording a $540 million net outflow last week, signaling institutional demand weakness.

Money market outlook 2025: Trends and dynamics in the Eurozone, US, and UK
We delve into the world of money market funds. Distinct dynamics are at play in the US, eurozone, and UK. In the US, repo rates are more attractive, and bills are expected to appreciate. It's also worth noting that the Fed might cut rates more than anticipated, similar to the UK. In the eurozone, unsecured rates remain elevated.

The Best brokers to trade EUR/USD
SPONSORED Discover the top brokers for trading EUR/USD in 2025. Our list features brokers with competitive spreads, fast execution, and powerful platforms. Whether you're a beginner or an expert, find the right partner to navigate the dynamic Forex market.