|

Nifty producing strong reaction higher from blue box area

In this technical blog, we will look at the past performance of the 4-hour Elliott Wave Charts of the Nifty index. In which, the rally from the 17 June 2022 low is unfolding as an impulse structure. Showing a higher high sequence favored more upside extension to take place. Therefore, we advised members not to sell the index & buy the dips in 3, 7, or 11 swings at the blue box areas. We will explain the structure & forecast below:

Nifty 4-hour Elliott Wave chart from 10.26.2023

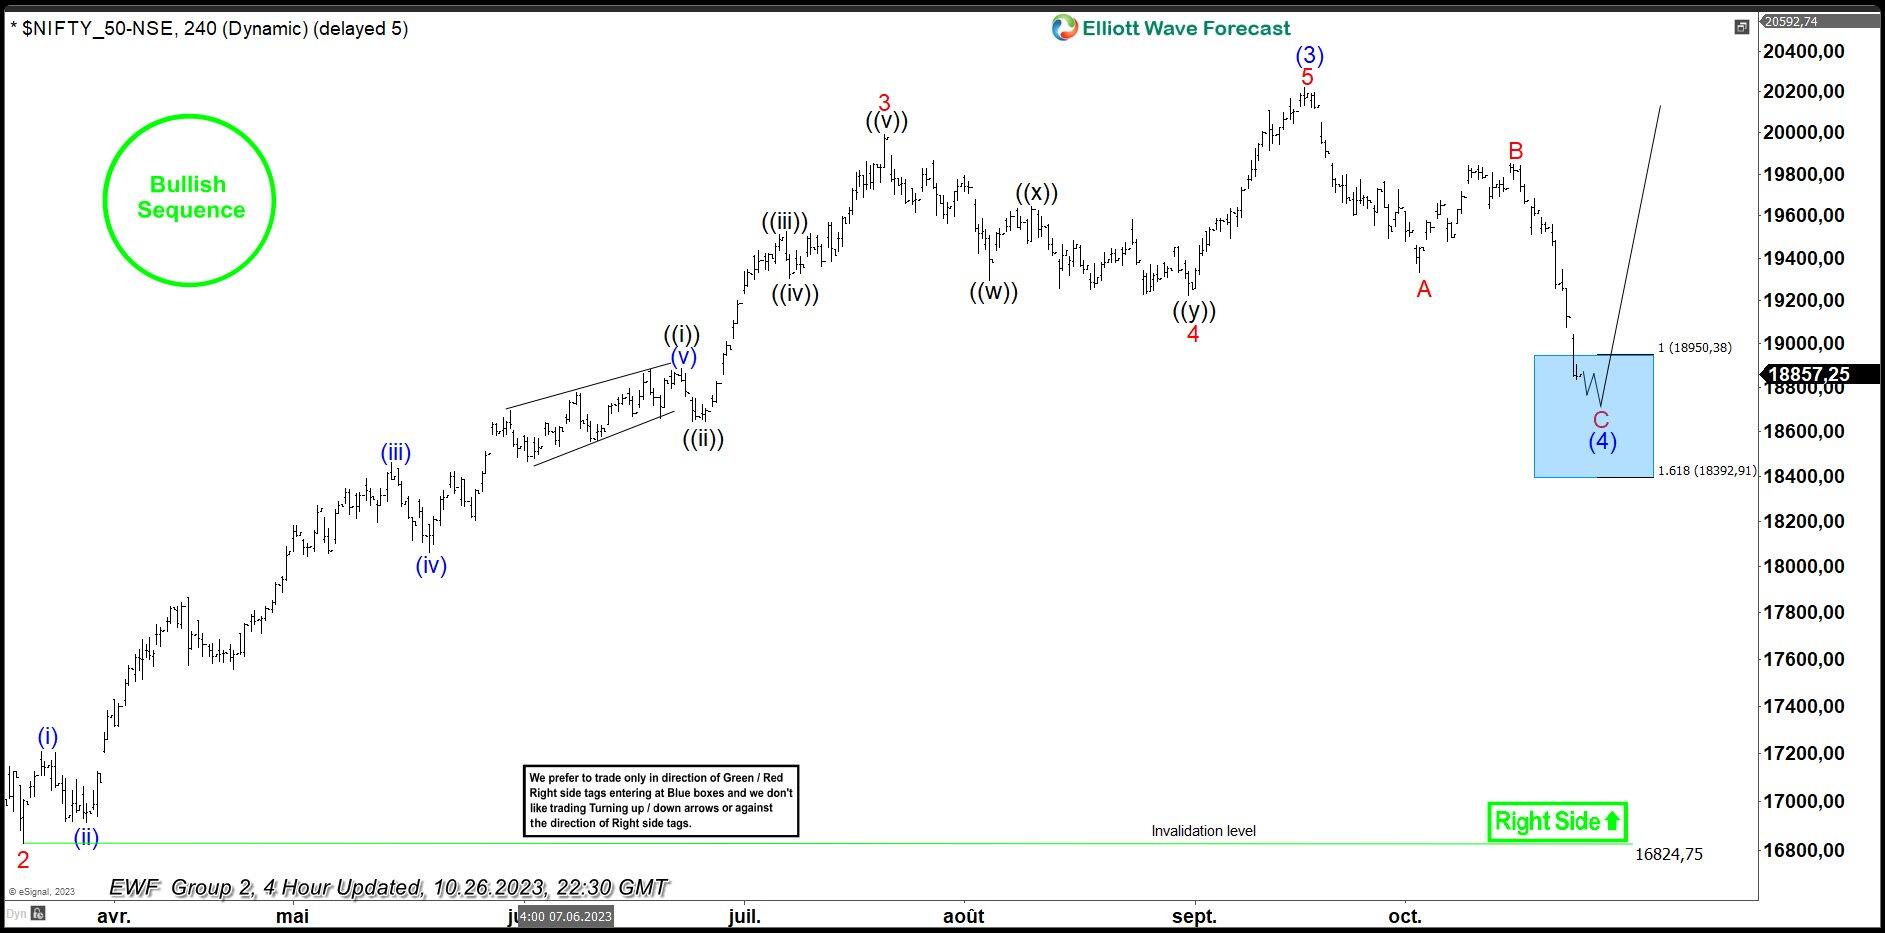
Here’s the 4-hour Elliott wave chart from the 10/26/2023 update. In which, the cycle from the 9/30/2022 low ended in a bigger wave (3) as an impulse structure at 20222.45 high. Down from there, the index made a pullback in wave (4) to correct that cycle. The internals of that pullback unfolded as Elliott wave zigzag structure where wave A ended at 19333.60 low. While wave B bounce ended at 19849.75 high. Then wave C managed to reach the blue box area at 18950.38- 18392.91. From there, buyers were expected to appear looking for the next leg higher or for a 3 wave bounce minimum.

Nifty latest 4-hour Elliott Wave chart from 11.13.2023

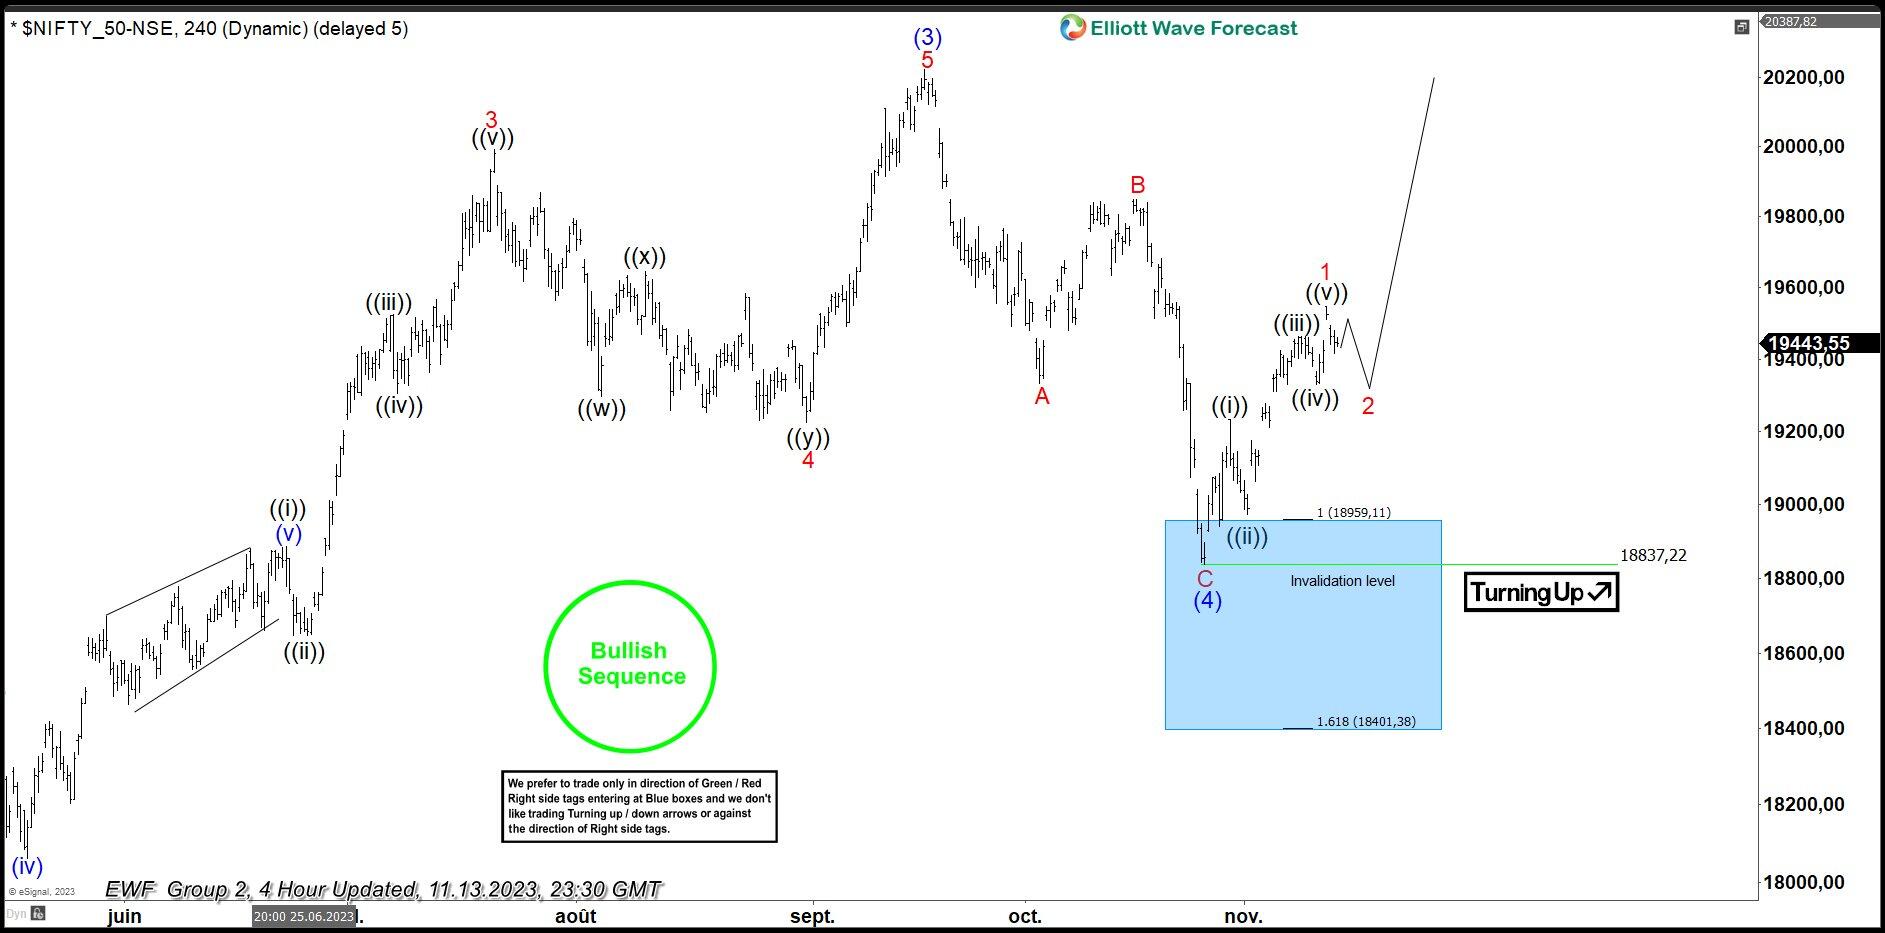
This is the latest 4-hour Elliott wave Chart from the 11/13/2023 update. In which the index shows a reaction higher taking place, right after ending the zigzag correction within the blue box area. Allowed members to create a risk-free position shortly after taking the long position at the blue box area. However, a break above the 20222.45 high is still needed to confirm the next extension higher & avoid a double correction lower.

Author

Elliott Wave Forecast Team

Elliott Wave Forecast Team

ElliottWave-Forecast.com

More from Elliott Wave Forecast Team
Share:

Editor's Picks

EUR/USD treads water above 1.1850 amid thin trading

EUR/USD stays defensive but holds 1.1850 amid quiet markets in the European hours on Monday.  The US Dollar is struggling for direction due to thin liquidity conditions as US markets are closed in observance of Presidents' Day. 

GBP/USD flat lines as traders await key UK and US macro data

GBP/USD kicks off a new week on a subdued note and oscillates in a narrow range near 1.365 in Monday's European trading. The mixed fundamental backdrop warrants some caution for aggressive traders as the market focus now shifts to this week's important releases from the UK and the US.

Gold sticks to intraday losses; lacks follow-through

Gold remains depressed through the early European session on Monday, though it has managed to rebound from the daily trough and currently trades around the $5,000 psychological mark. Moreover, a combination of supporting factors warrants some caution for aggressive bearish traders, and before positioning for deeper losses.

Bitcoin, Ethereum and Ripple consolidate within key ranges as selling pressure eases

Bitcoin and Ethereum prices have been trading sideways within key ranges following the massive correction. Meanwhile, XRP recovers slightly, breaking above the key resistance zone. The top three cryptocurrencies hint at a potential short-term recovery, with momentum indicators showing fading bearish signs.

Global inflation watch: Signs of cooling services inflation

Realized inflation landed close to expectations in January, as negative base effects weighed on the annual rates. Remaining sticky inflation is largely explained by services, while tariff-driven goods inflation remains limited even in the US.

Ripple Price Forecast: XRP potential bottom could be in sight

Ripple edges up above the intraday low of $1.35 at the time of writing on Friday amid mixed price actions across the crypto market. The remittance token failed to hold support at $1.40 the previous day, reflecting risk-off sentiment amid a decline in retail and institutional sentiment.