In this technical article we’re going to take a look at the Elliott Wave charts of NIFTY Index from India, presented in members area of the of our website. As our members know, break of 01/24 (16836.9) low ,made incomplete sequences from the 18352.97 peak , which increases chances of getting another leg down within the cycle from the October 19th 2021 peak.

Before we take a look at the real market example, let’s explain Elliott Wave Double Three pattern.

Elliott Wave double three pattern

Double three is the common pattern in the market , also known as 7 swing structure. It’s a reliable pattern which is giving us good trading entries with clearly defined invalidation levels. The picture below presents what Elliott Wave Double Three pattern looks like. It has (W),(X),(Y) labeling and 3,3,3 inner structure, which means all of these 3 legs are corrective sequences. Each (W) and (Y) are made of 3 swings , they’re having A,B,C structure in lower degree, or alternatively they can have W,X,Y labeling.

Before we take a look at the H4 chart, to see what Elliott Wave Double Three Pattern looks like in real market example, let’s see a NIFTY h1 chart and explain the reason of calling another leg down in Index.

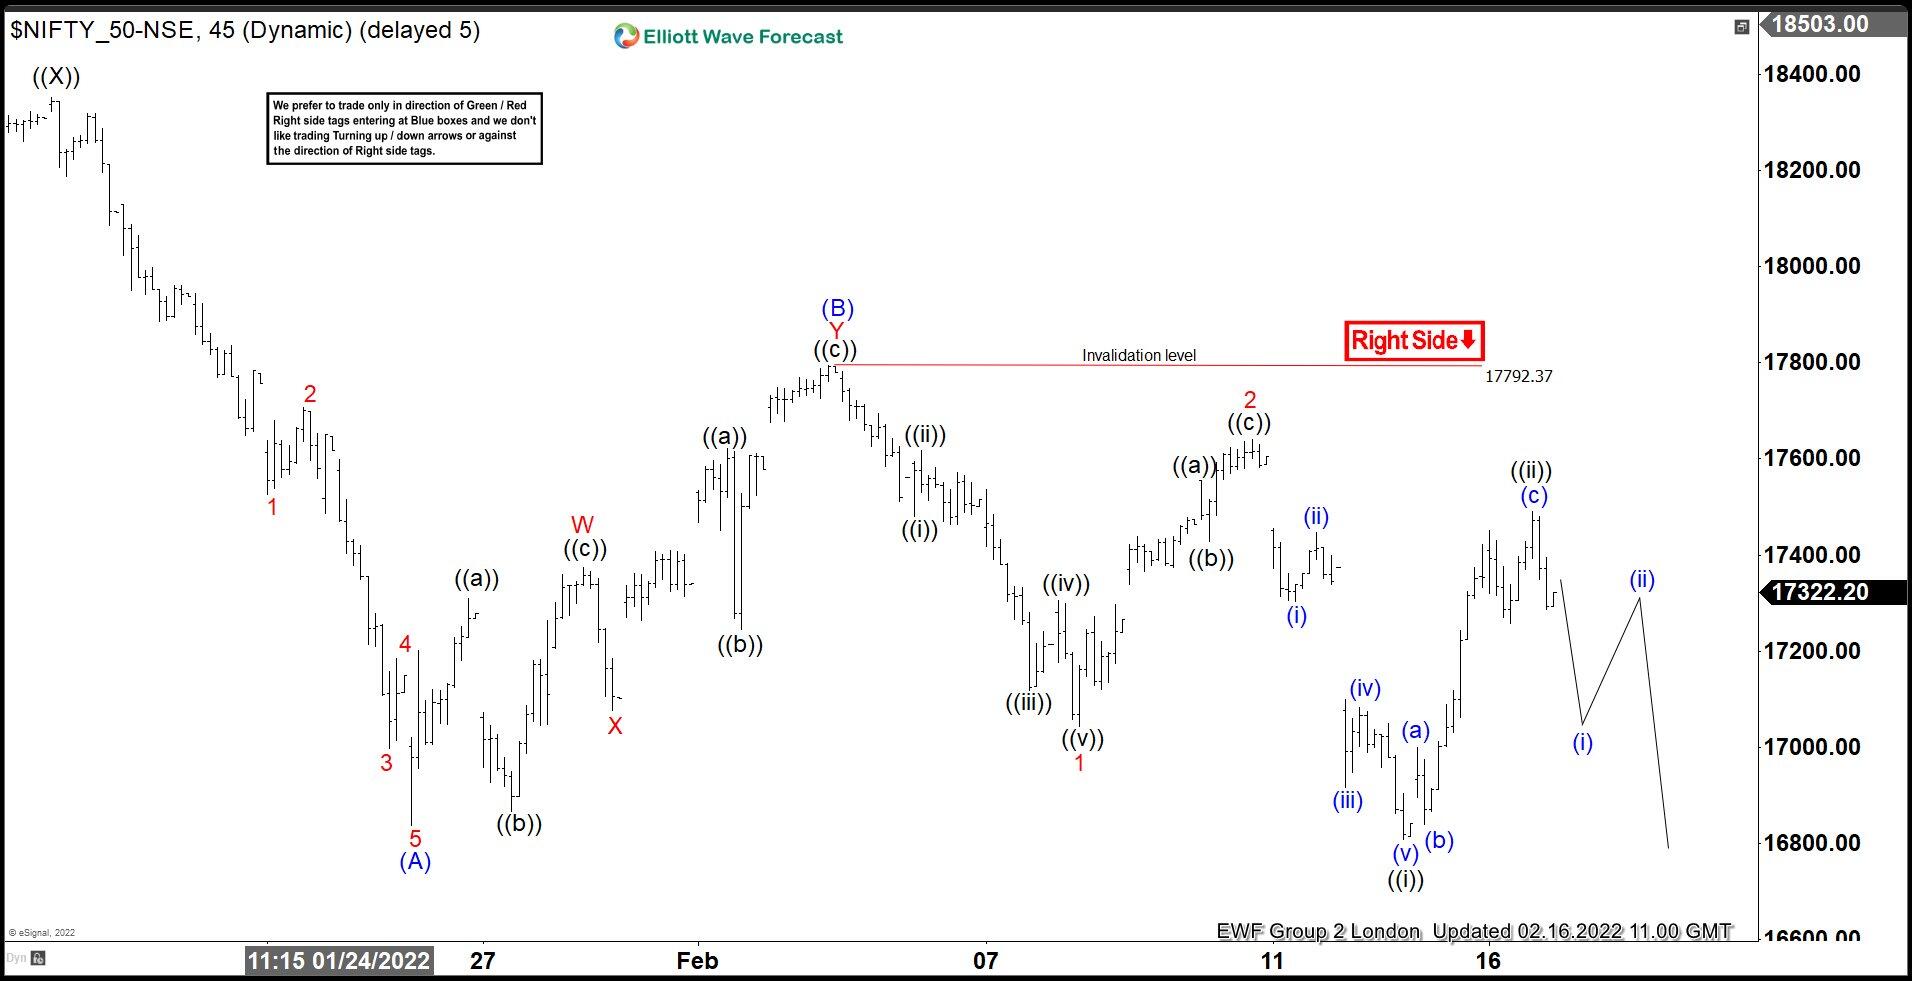
NIFTY 1 hour Elliott Wave analysis 02.16.2021

The index has made break of January 24th low (16836.9)- which is marked as (A) blue on the chart. The index is now showing incomplete bearish sequences from the 18352.97 peak, which suggest further weakness in near term. NIFTY remains bearish against the 17792.37 peak. Proposed decline in short term cycle makes December 20th low more vulnerable. So, we are calling for a 7th swing down from the major October 19th 2021 peak.

Chart

Now, let’s take a look at NIFTY h4 chart from March 3rd to see what Elliott Wave Double Three pattern looks like in real example.

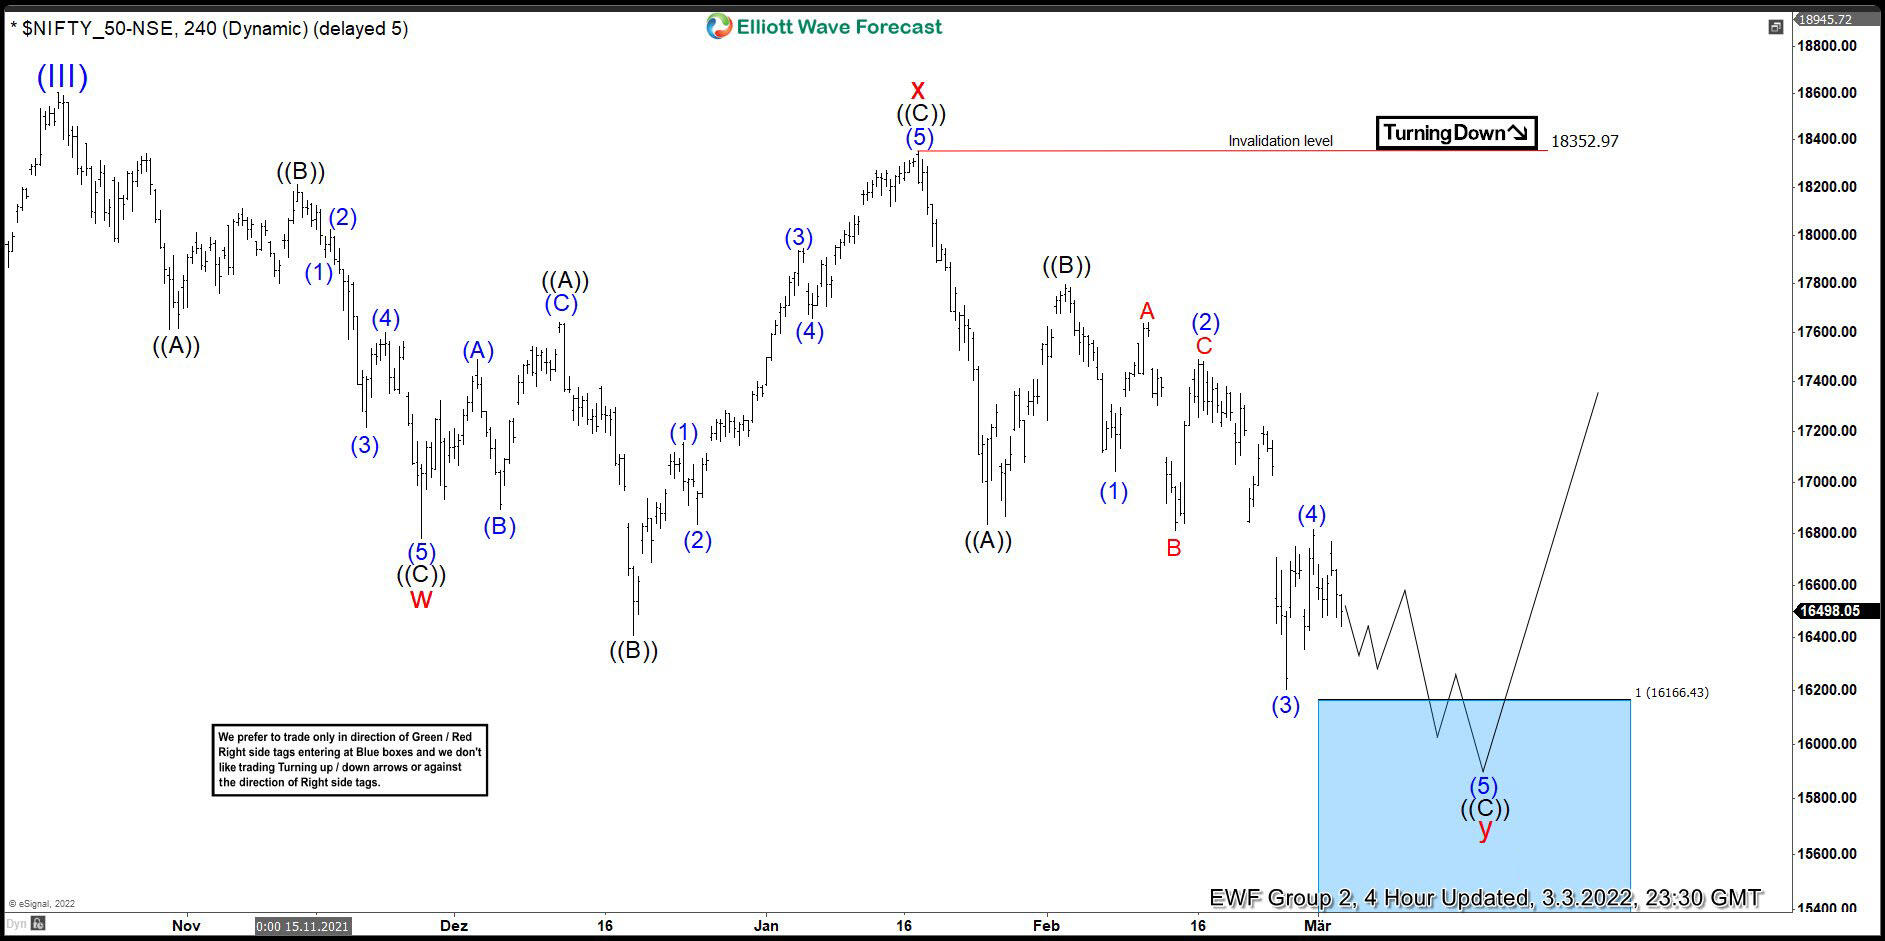
NIFTY 4 hour Elliott Wave analysis 03.03.2021

We assume that cycle from the peak has a form of Elliott Wave Double Three Pattern , labeled as WXY red. We can notice that each of legs have corrective structure – ((A)),((B)),((C)) black, when X red connector has form of Irregular Flat Pattern. Eventually we got a break of December 20th low- ((B)) black on this chart. Current price structure confirms we are in 7th swing down in the cycle from the October 19th 2021 peak. The price still miss the extreme from the peak, so we are calling for another leg down toward 16166.4-15645.28 ( buyers zone). From that area we expect to see larger 3 waves bounce at least. First target would be 50 fibs against the X red ( 18352.9) peak. Once it’s reached buyers should make long positions risk free (put SL at BE) and take partial profits from the trade.

Chart

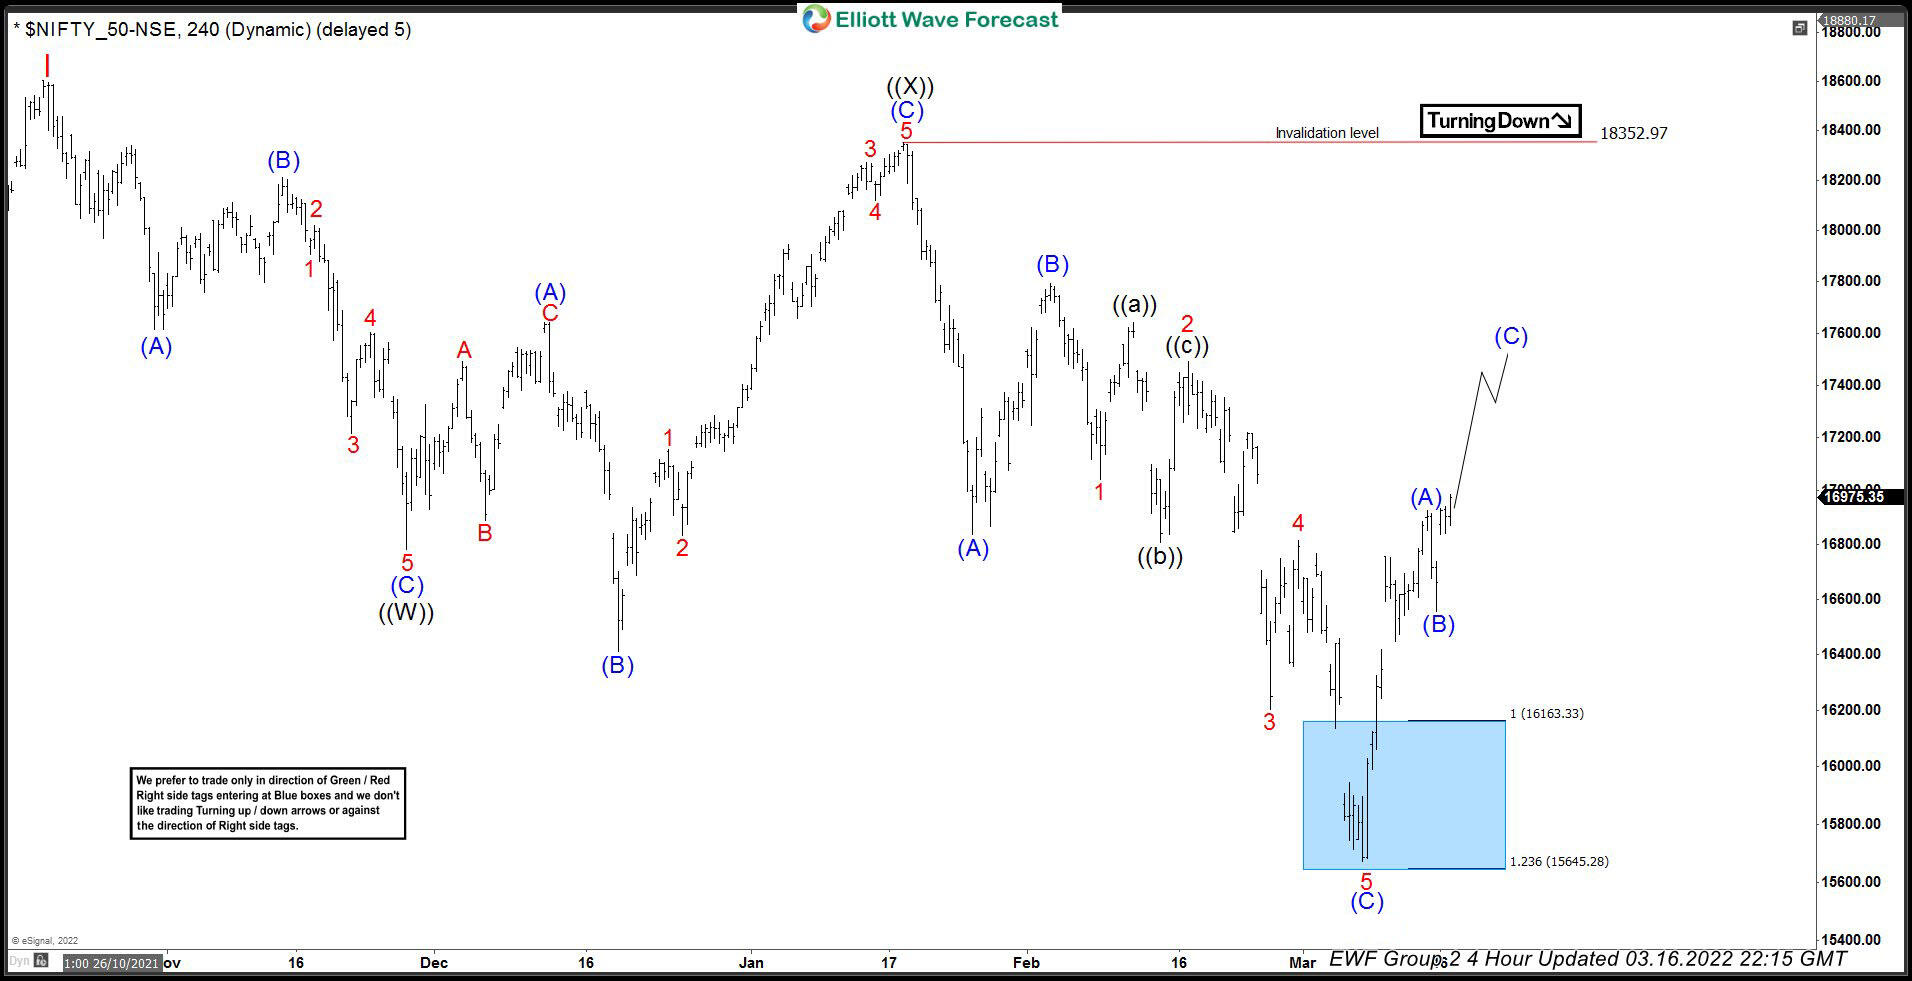
NIFTY 4 hour Elliott Wave analysis 03.16.2021

Eventually we got another leg down as expected. Buyers appeared at the blue box and we are getting good reaction from there. The rally from the blue box reached and exceeded 50 fibs against the connector. As a result any long positions are enjoying profits in a risk free positions. Short term rally looks to be unfolding as a Elliott Wave Zig Zag Pattern, targeting approximately 17816+ area.

Chart

Share: Feed news

FURTHER DISCLOSURES AND DISCLAIMER CONCERNING RISK, RESPONSIBILITY AND LIABILITY Trading in the Foreign Exchange market is a challenging opportunity where above average returns are available for educated and experienced investors who are willing to take above average risk. However, before deciding to participate in Foreign Exchange (FX) trading, you should carefully consider your investment objectives, level of xperience and risk appetite. Do not invest or trade capital you cannot afford to lose. EME PROCESSING AND CONSULTING, LLC, THEIR REPRESENTATIVES, AND ANYONE WORKING FOR OR WITHIN WWW.ELLIOTTWAVE- FORECAST.COM is not responsible for any loss from any form of distributed advice, signal, analysis, or content. Again, we fully DISCLOSE to the Subscriber base that the Service as a whole, the individual Parties, Representatives, or owners shall not be liable to any and all Subscribers for any losses or damages as a result of any action taken by the Subscriber from any trade idea or signal posted on the website(s) distributed through any form of social-media, email, the website, and/or any other electronic, written, verbal, or future form of communication . All analysis, trading signals, trading recommendations, all charts, communicated interpretations of the wave counts, and all content from any media form produced by www.Elliottwave-forecast.com and/or the Representatives are solely the opinions and best efforts of the respective author(s). In general Forex instruments are highly leveraged, and traders can lose some or all of their initial margin funds. All content provided by www.Elliottwave-forecast.com is expressed in good faith and is intended to help Subscribers succeed in the marketplace, but it is never guaranteed. There is no “holy grail” to trading or forecasting the market and we are wrong sometimes like everyone else. Please understand and accept the risk involved when making any trading and/or investment decision. UNDERSTAND that all the content we provide is protected through copyright of EME PROCESSING AND CONSULTING, LLC. It is illegal to disseminate in any form of communication any part or all of our proprietary information without specific authorization. UNDERSTAND that you also agree to not allow persons that are not PAID SUBSCRIBERS to view any of the content not released publicly. IF YOU ARE FOUND TO BE IN VIOLATION OF THESE RESTRICTIONS you or your firm (as the Subscriber) will be charged fully with no discount for one year subscription to our Premium Plus Plan at $1,799.88 for EACH person or firm who received any of our content illegally through the respected intermediary’s (Subscriber in violation of terms) channel(s) of communication.

XM
Account
7.2
Tools
9.2
Service
9.4
Trading
9.0
Trust
7.0
Experience
8.4
Read review
Moneta Markets
Account
7.4
Tools
6.6
Service
8.0
Trading
6.6
Trust
5.2
Experience
9.2
Read review
Trading Pro
Account
7.2
Tools
5.2
Service
6.6
Trading
8.0
Trust
5.0
Experience
7.0
Read review
Pepperstone
Account
8.2
Tools
8.2
Service
7.4
Trading
9.0
Trust
8.8
Experience
9.0
Read review
XM
Read review
Moneta Markets
Read review
Trading Pro
Read review
Pepperstone
Read review
Trading Pro
Read review
Pepperstone
Read review
XM
Read review
Moneta Markets
Read review
Trading Pro
Account
7.2
Tools
5.2
Service
6.6
Trading
8.0
Trust
5.0
Experience
7.0
Read review
Pepperstone
Account
8.2
Tools
8.2
Service
7.4
Trading
9.0
Trust
8.8
Experience
9.0
Read review
XM
Account
7.2
Tools
9.2
Service
9.4
Trading
9.0
Trust
7.0
Experience
8.4
Read review
Moneta Markets
Account
7.4
Tools
6.6
Service
8.0
Trading
6.6
Trust
5.2
Experience
9.2
Read review

Recommended content


Recommended content

Editors’ Picks

Gold hovers around all-time highs near $3,250

Gold hovers around all-time highs near $3,250


Gold is holding steady near the $3,250 mark, fuelled by robust safe-haven demand, trade war concerns, and a softer-than-expected US inflation gauge. The US Dollar keeps trading with heavy losses around three-year lows.

Gold News
EUR/USD retreats towards 1.1300 as Wall Street shrugs off trade war headlines

EUR/USD retreats towards 1.1300 as Wall Street shrugs off trade war headlines

The EUR/USD pair retreated further from its recent multi-month peak at 1.1473 and trades around the 1.1300 mark. Wall Street manages to advance ahead of the weekly close, despite escalating tensions between Washington and Beijing and mounting fears of a US recession. Profit-taking ahead of the close also weighs on the pair. 

EUR/USD News
GBP/USD trims gains, recedes to the 1.3050 zone

GBP/USD trims gains, recedes to the 1.3050 zone

GBP/USD now gives away part of the earlier advance to fresh highs near 1.3150. Meanwhile, the US Dollar remains offered amid escalating China-US trade tensions, recession fears in the US, and softer-than-expected US Producer Price data.

GBP/USD News
Bitcoin, Ethereum, Dogecoin and Cardano stabilze –  Why crypto is in limbo

Bitcoin, Ethereum, Dogecoin and Cardano stabilze –  Why crypto is in limbo

Bitcoin, Ethereum, Dogecoin and Cardano stabilize on Friday as crypto market capitalization steadies around $2.69 trillion. Crypto traders are recovering from the swing in token prices and the Monday bloodbath. 

Read more
Is a recession looming?

Is a recession looming?

Wall Street skyrockets after Trump announces tariff delay. But gains remain limited as Trade War with China continues. Recession odds have eased, but investors remain fearful. The worst may not be over, deeper market wounds still possible.

Read more
The Best brokers to trade EUR/USD

The Best brokers to trade EUR/USD

SPONSORED Discover the top brokers for trading EUR/USD in 2025. Our list features brokers with competitive spreads, fast execution, and powerful platforms. Whether you're a beginner or an expert, find the right partner to navigate the dynamic Forex market.

Read More

Forex MAJORS

Cryptocurrencies

Signatures

Best Brokers of 2025