Nifty buying the dips at the blue box area

In this article we’re going to take a quick look at the Elliott Wave charts of NIFTY published in members area of the website. As our members know, NIFTY is showing impulsive bullish sequences, suggesting further extension to the upside . Recently we got a 3 waves pull back that has ended right at the Blue Box zone (buying area). In the further text we are going to explain the Elliott Wave Forecast and trading setup.
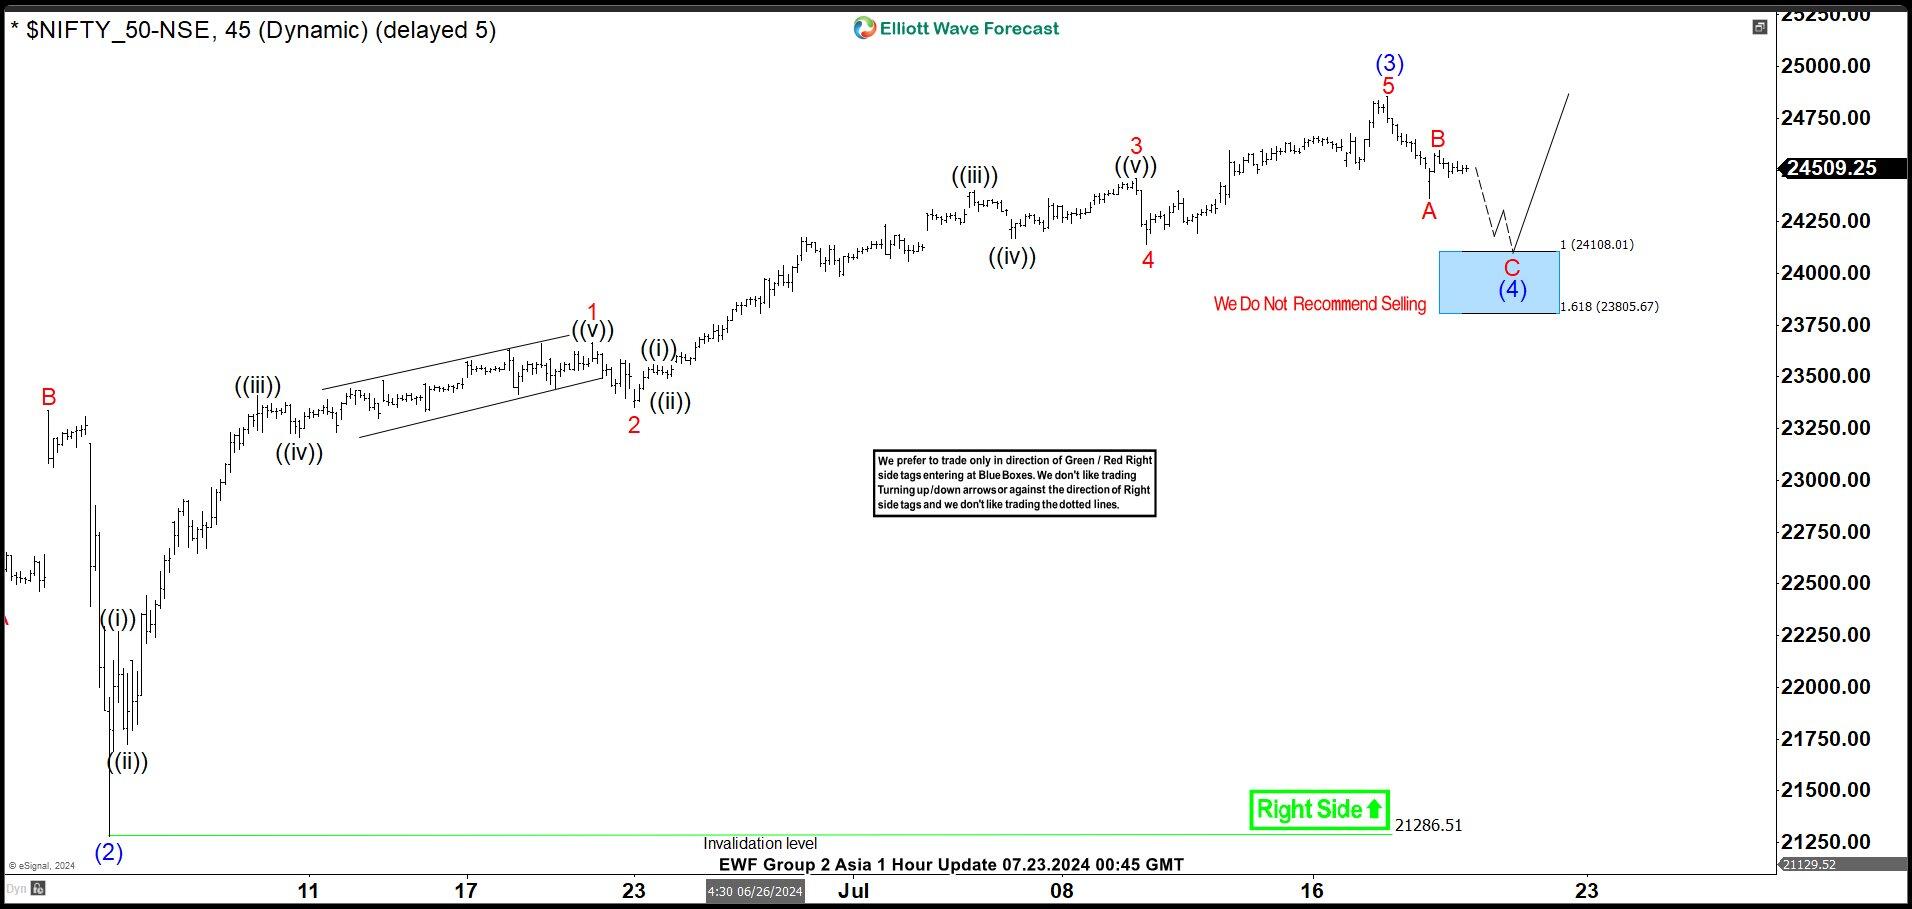
Nifty Elliott Wave one-hour Asia chart 07.23.2024
NIFTY remains bullish against the 21286.5 pivot. The Index is currently giving us pull back in 3 waves , wave (4) blue. The price made 5 waves from the peak, suggesting NIFTY ended only first leg A of (4) that is unfolding as Elliott Wave Zig Zag pattern. We expect NIFTY to make another leg down toward extreme area at 24108-23805 blue box ( buying zone). From there, NIFTY index should ideally make a rally toward new highs or 3 waves bounce alternatively. As our members know Blue boxes are based on 100% – 161.8% Fibonacci extension area, that we trade in 3, 7, or 11 swing corrective sequence.
Once the price touches the 50 fibs against the B red connector, we’ll make positions risk-free and set the stop loss at breakeven and book partial profits. Breaking below the 1.618 Fibonacci extension level at 23805 would invalidate the trade.
Official trading strategy on How to trade 3, 7, or 11 swing and equal leg is explained in details in Educational Video, available for members viewing inside the membership area.
Quick reminder on how to trade our charts :
Red bearish stamp+ blue box = Selling Setup.
Green bullish stamp+ blue box = Buying Setup.
Charts with Black stamps are not tradable.
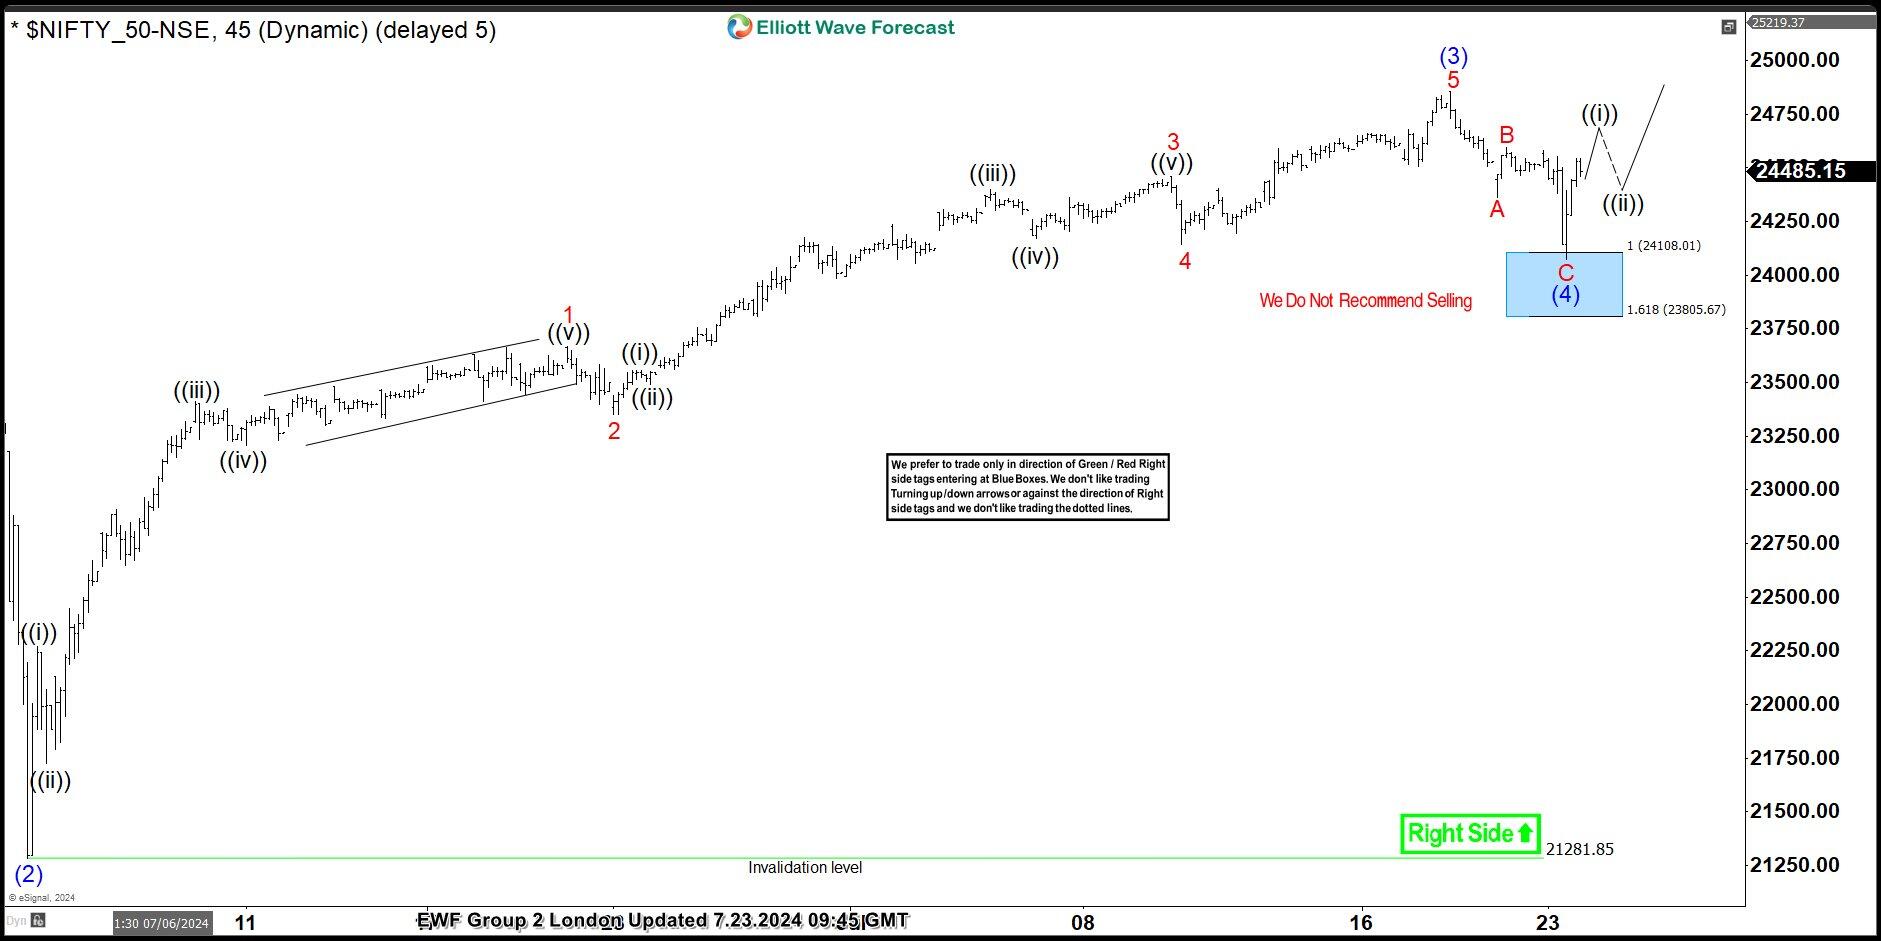
NIFTY Elliott Wave one-hour London Chart 07.23.2024
NIFTY made the drop toward our Blue Box area and found buyers as expected. We got nice reaction from our buying zone. The index has reached and exceeded 50 fibs against the B red high. So members who took the long trade are enjoying profits now in a risk free positions. We would like to see break of (3) blue peak, to confirm next leg up is in progress.
Elliott Wave Forecast
Author

Elliott Wave Forecast Team
ElliottWave-Forecast.com


