NIFTY 50 (Indian Stocks) Elliott Wave technical analysis [Video]
![NIFTY 50 (Indian Stocks) Elliott Wave technical analysis [Video]](https://editorial.fxsstatic.com/images/i/wall-street-02_XtraLarge.jpg)
NIFTY 50 Index – Elliott Wave technical analysis
-
Function: Counter Trend (Minor Degree, Grey).
-
Mode: Corrective.
-
Structure: Zigzag.
-
Position: Minute Wave ((c)).
-
Invalidation point: 26,400.
Details:
The alternate wave count is currently preferred, with a potential ((a)) - ((b)) - ((c)) zigzag pattern appearing complete around the 22,500 - 22,550 zone. There is a high probability of a counter-trend rally emerging either from this level or near 22,100.
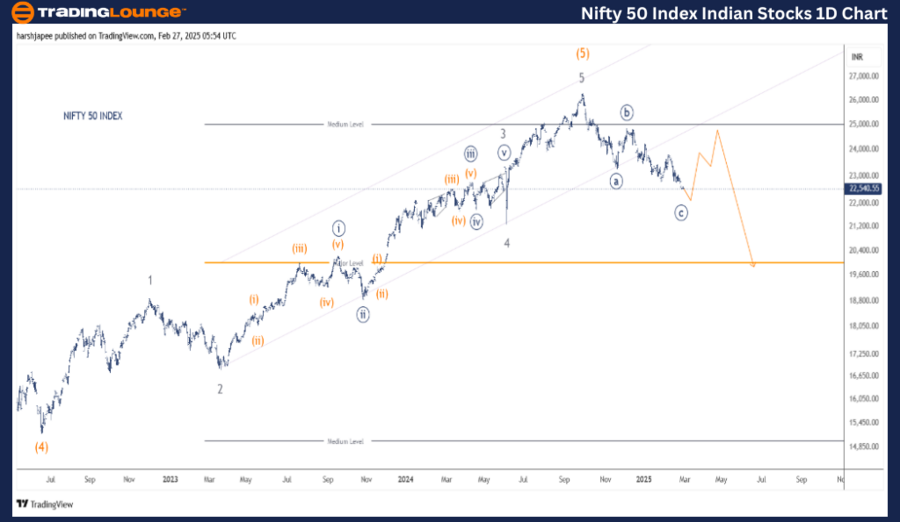
NIFTY 50 Index daily chart – Technical analysis and Elliott Wave counts
The NIFTY 50 Daily Chart suggests that a major top was established around the 26,300 mark in September 2024. A high-probability Elliott Wave count indicates:
-
Minute Wave ((a)) / ((i)) formed around 23,267.
-
Wave ((b)) / ((ii)) followed by Wave ((c)) / ((iii)), moving toward 24,900 and the 22,500 - 22,550 zone.
-
Previously, the Intermediate Wave (4) Orange ended near the 15,200 lows, followed by a Minor degree impulse (Waves 1-5) that pushed prices to 26,300, marking the termination of Wave (5).
Bulls might attempt a rally towards the 24,700 range in the near future. However, if the correction ends at the 22,400 mark, there is a low probability of a move back toward the 26,300 mark.
NIFTY 50 Index – Elliott Wave technical analysis
-
Function: Counter Trend (Minor Degree, Grey)
-
Mode: Corrective
-
Structure: Zigzag
-
Position: Minute Wave ((c))
-
Invalidation point: 26,400
Details:
The alternate wave count remains in focus, suggesting a ((a)) - ((b)) - ((c)) zigzag structure, which may be nearing completion around the 22,500 - 22,550 zone. A counter-trend rally remains likely from this level or near the 22,100 mark. Alternatively, NIFTY could be progressing within Minute Wave ((iii)), making it a sell on rallies.
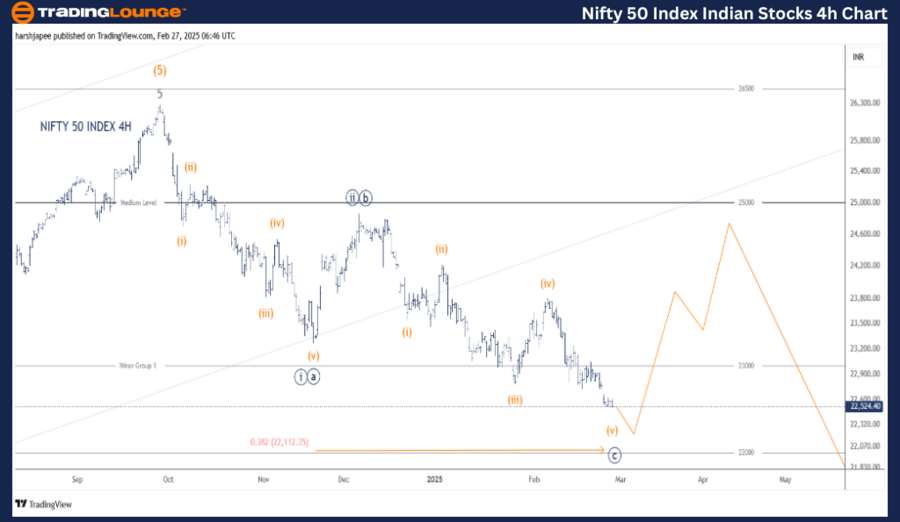
NIFTY 50 Index four-hour chart – Technical analysis and Elliott Wave counts
The NIFTY 50 4H Chart highlights the sub-wave structures since the 26,280 - 26,300 high on September 27, 2024. Adjustments have been made to reflect a ((a)) - ((b)) - ((c)) zigzag pattern, likely completed from the 26,280 highs.
Alternatively:
-
Minute Wave ((i)) - ((ii)) may be complete, with ((iii)) currently unfolding
-
The initial drop to 23,257 has been labeled Minute Wave ((a)) / ((i))
-
This was followed by Wave ((b)) / ((ii)), reaching 24,900
-
Minute Wave ((c)) / ((iii)) might be nearing completion around the 22,500 - 22,550 zone
If this wave structure holds, a counter-trend rally toward 24,400 - 24,500 could materialize before either a larger correction or a push toward fresh highs above 26,300. A break above 23,750 will confirm that bulls have regained control.
Conclusion
The NIFTY 50 INDEX is currently moving lower toward the 22,000 - 22,100 zone within a larger corrective structure.
NIFTY 50 (Indian Stocks) Elliott Wave technical analysis [Video]
Author

Peter Mathers
TradingLounge
Peter Mathers started actively trading in 1982. He began his career at Hoei and Shoin, a Japanese futures trading company.


